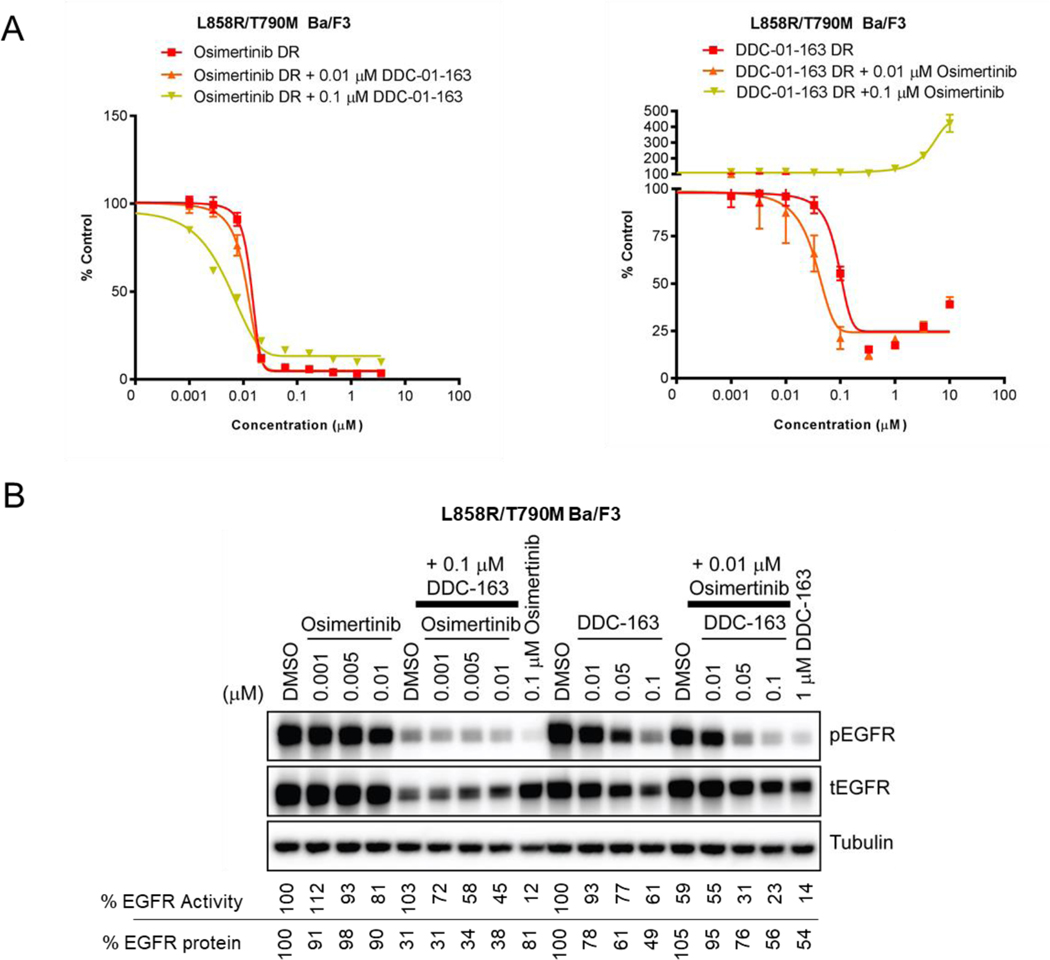
Figure 6.
(A) Cell viability assay examining the growth inhibitory effect of L858R/T790M Ba/F3 cells and (B) Western blot analyses assessing the EGFR activity (phospho-EGFR) and protein degradation levels (total EGFR) after treatment with dose escalated osimertinib and DDC-01-163 alone (DR) or in the presence of a constant dose of DDC-01-163 or osimertinib respectively in L88R/T790M Ba/3 cells. Tubulin was used as a loading control for relative protein expression. Densitometry analyses were performed and the percentage of EGFR protein left shown is compared to DMSO control after data was normalized to tubulin. The percentage of EGFR activity shown is compared to the DMSO control after data was normalized to total EGFR.

