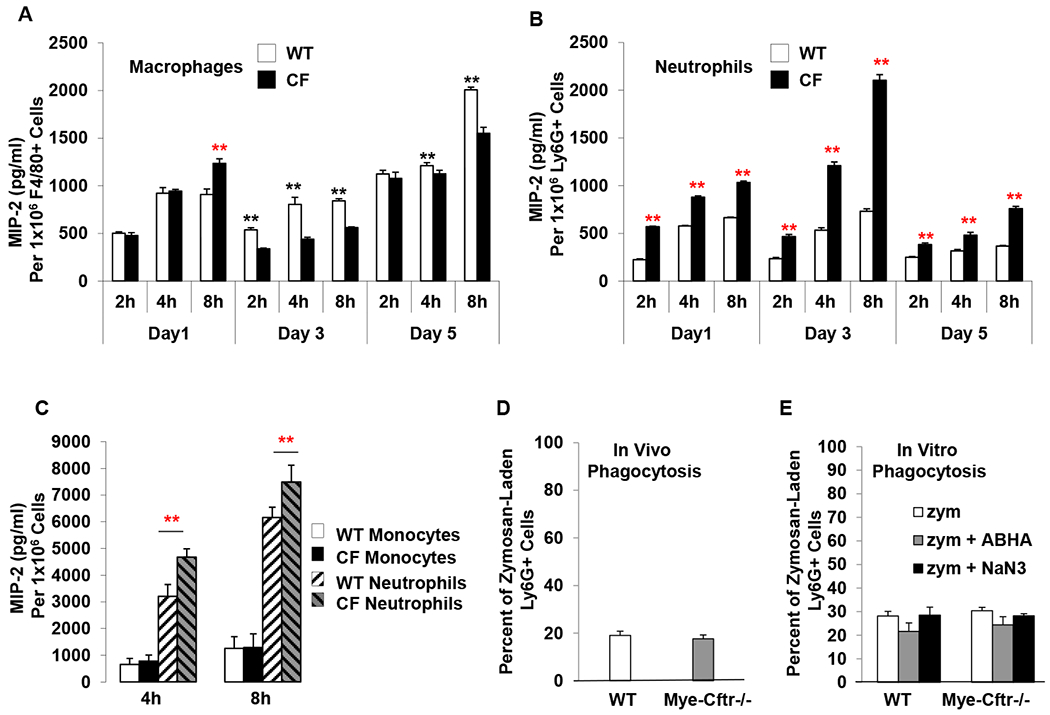
Figure 5 – In vitro production of MIP-2 by neutrophils and macrophages.

A & B) MIP-2 production by zymosan-pre-activated neutrophils and macrophages from WT and Mye-Cftr−/− mice that had been intraperitoneally challenged with sub-lethal dose zymosan (0.7 g/kg) for different times (1, 3 or 5 days). Peritoneal inflammatory cells were harvested and immunostained with the Ly6G and Anti-F4/80 antibodies, followed by FACS-sorting of neutrophils and macrophages. After culturing for 2, 4 and 8 hours, the media of each type of cells were sampled for MIP-2 measurements. Statistical analyses by Student’s t-test were performed to determine differences in MIP-2 production between the WT and Mye-Cftr−/− cells. Black asterisks indicate that the level of MIP-2 produced by WT cells is greater than that of Mye-Cftr−/− cells (P<0.01, n=4), while red asterisks indicate the opposite (P<0.01, n=4). C) MIP-2 production by neutrophils and monocytes isolated from peripheral blood and activated in vitro with zymosan. Asterisks indicate significant differences in MIP-2 production by Student’s t-test (P<0.01, n=4). D & E) Neutrophil phagocytosis comparison in vivo and in vitro. Fluorescently labeled zymosan particles were administered intraperitoneally into WT and Mye-Cftr−/− mice, respectively. Neutrophil phagocytosis was determined by flow cytometry (D). Peripheral blood neutrophils were isolated from WT and Mye-Cftr−/− mice. Opsonized fluorescent zymosan particles were allowed to phagocytose in the presence or absence of MPO inhibitor 4-amino-benzoic acid hydrazide (ABHA) or sodium azide (NaN3). Phagocytosis rates were compared by flow cytometry (E). No significant difference was detected by Student’s t-test between the two types of neutrophils.
