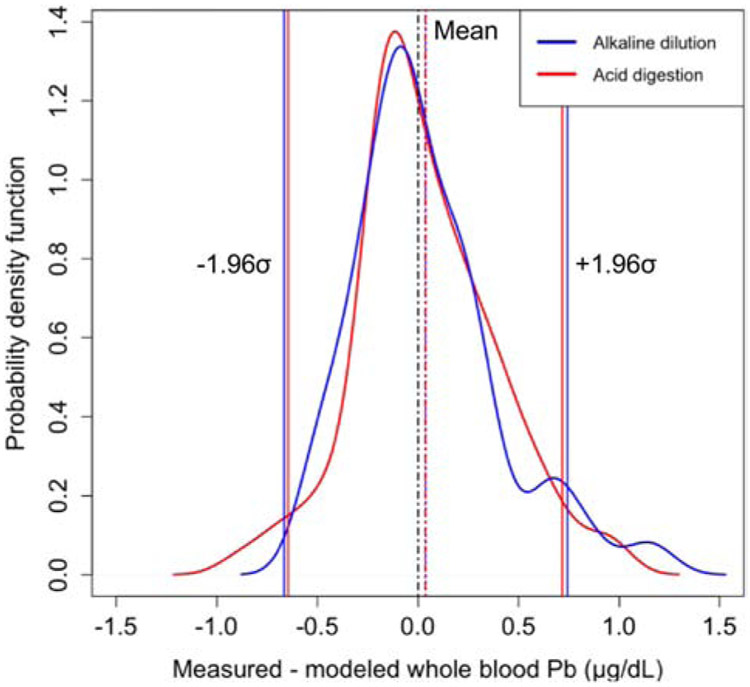
Figure 2.
Modified visual representation of the Bland-Altman analysis showing the distribution of the differences between the measured and modeled whole blood lead predicted using clotted erythrocyte fraction prepared using either acid digestion or alkaline dilution. The solid horizontal lines represent the standard deviation multiplied by 1.96, and dashed lines represent the mean method difference. Dashed black line represents a measured modeled difference of 0. The colors of the lines correspond to the clotted erythrocyte fraction sample predation method.

