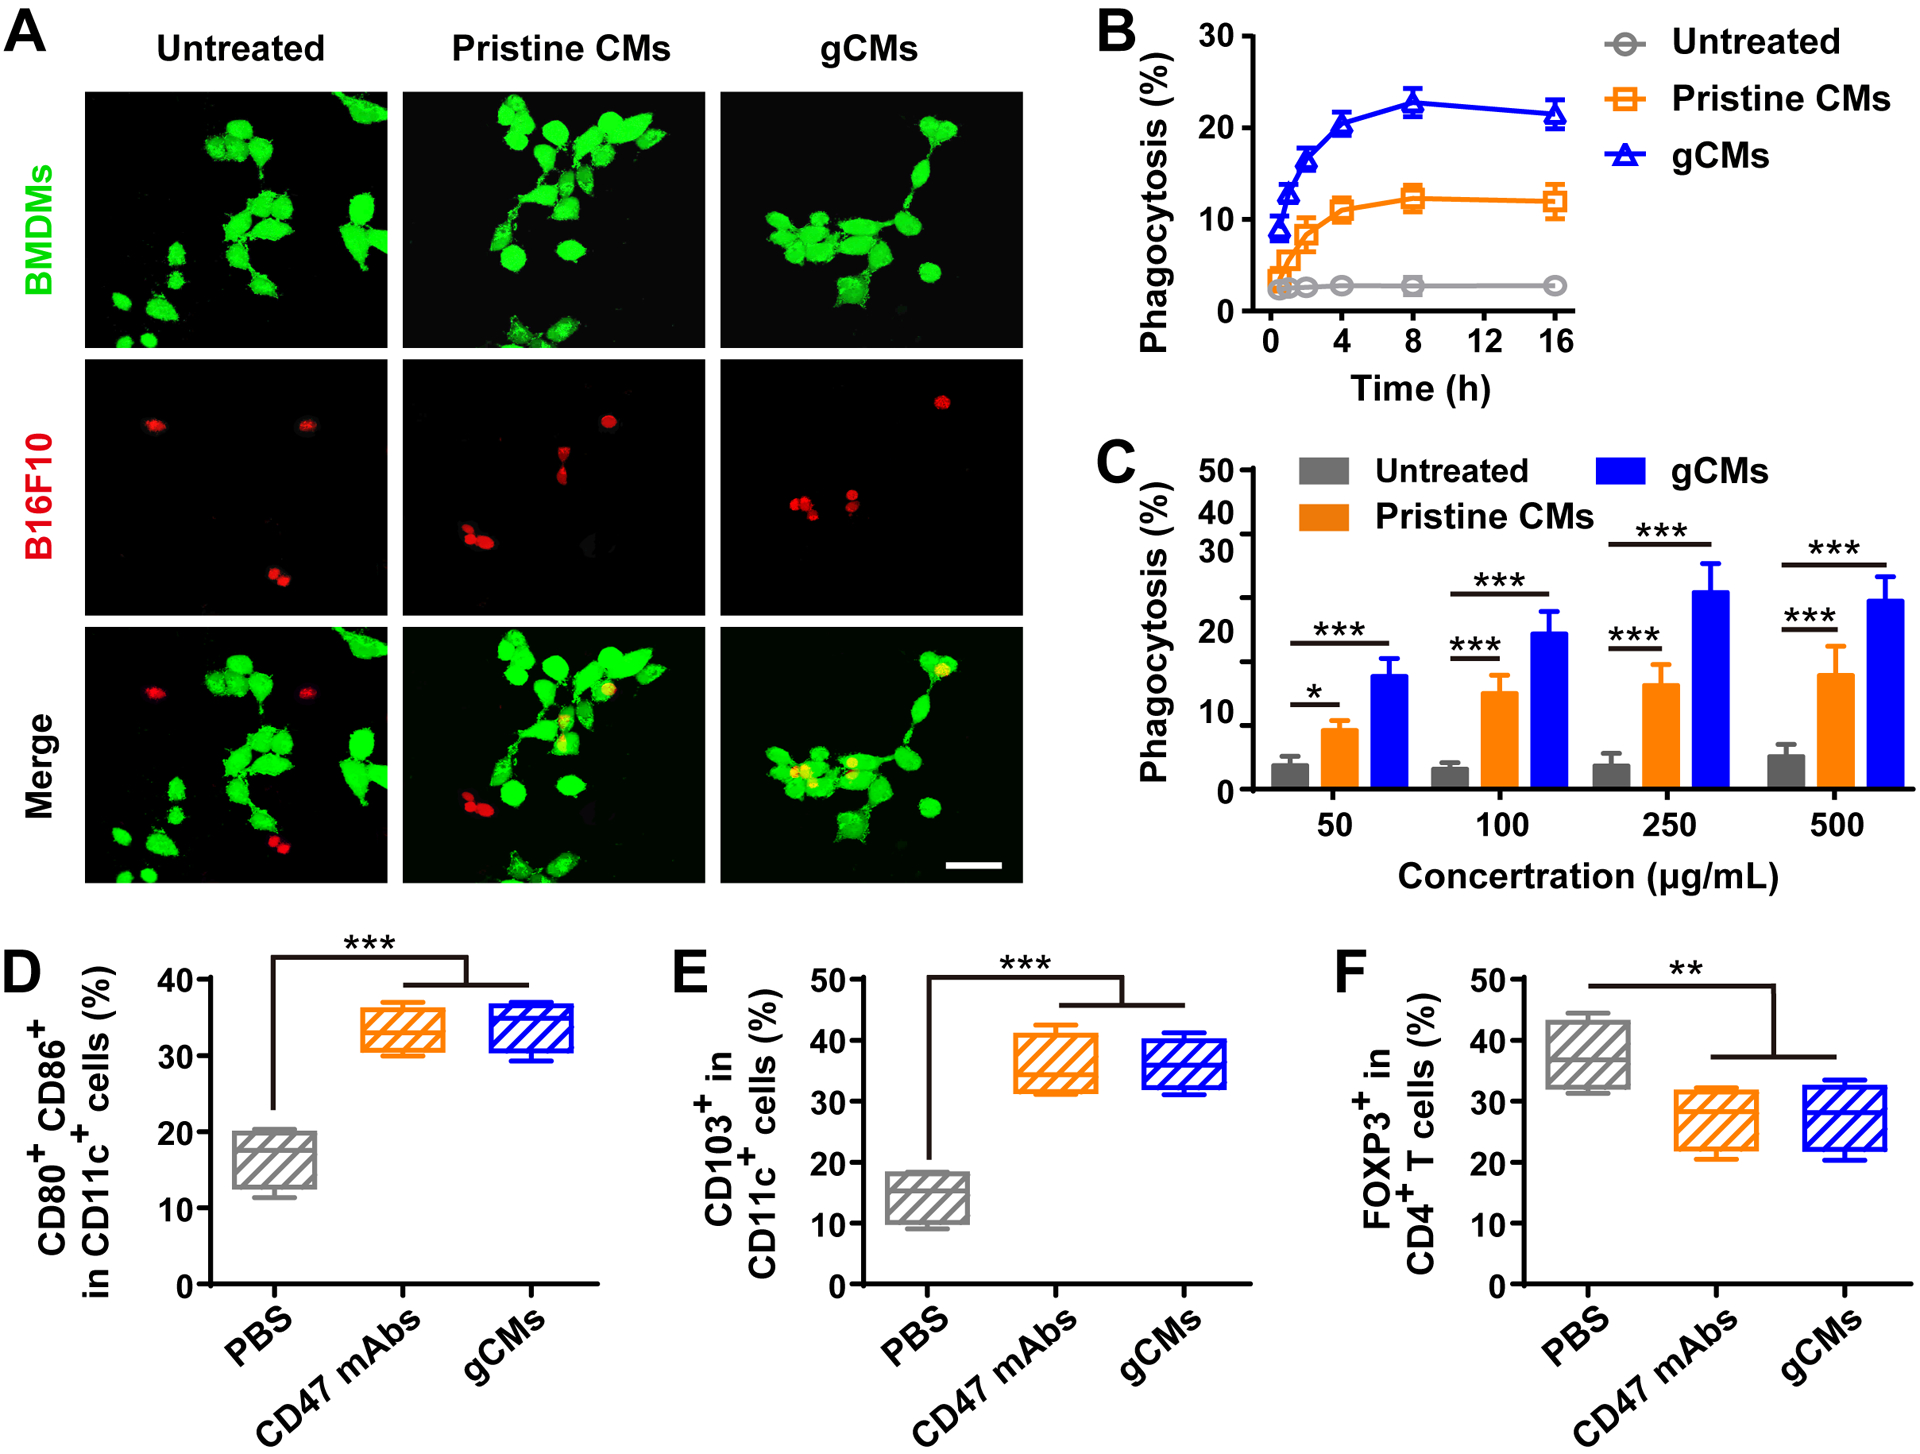
Figure 3.

gCMs increase macrophage phagocytosis in vitro and improve antigen presentation in vivo. A) Fluorescence images of the phagocytosis of B16F10 cells by BMDMs. Scale bar, 50 μm. Quantification analysis of the phagocytosis of B16F10 cells by BMDMs with B) different incubation time or C) different concentrations. Flow cytometric analysis of D) CD80+CD86+ dendritic cells and E) CD103+ dendritic cells in the tumor tissues gating on CD45+CD11c+ cells. F) Flow cytometric analysis of CD4+Foxp3+ T cells in tumor tissues gating on CD3+CD4+ cells. All data are presented as mean ± S.D. (n = 4). Statistical significance was calculated via ordinary one-way ANOVA with a Tukey’s test. *P < 0.05; **P < 0.01; ***P < 0.001.
