
Figure 4.
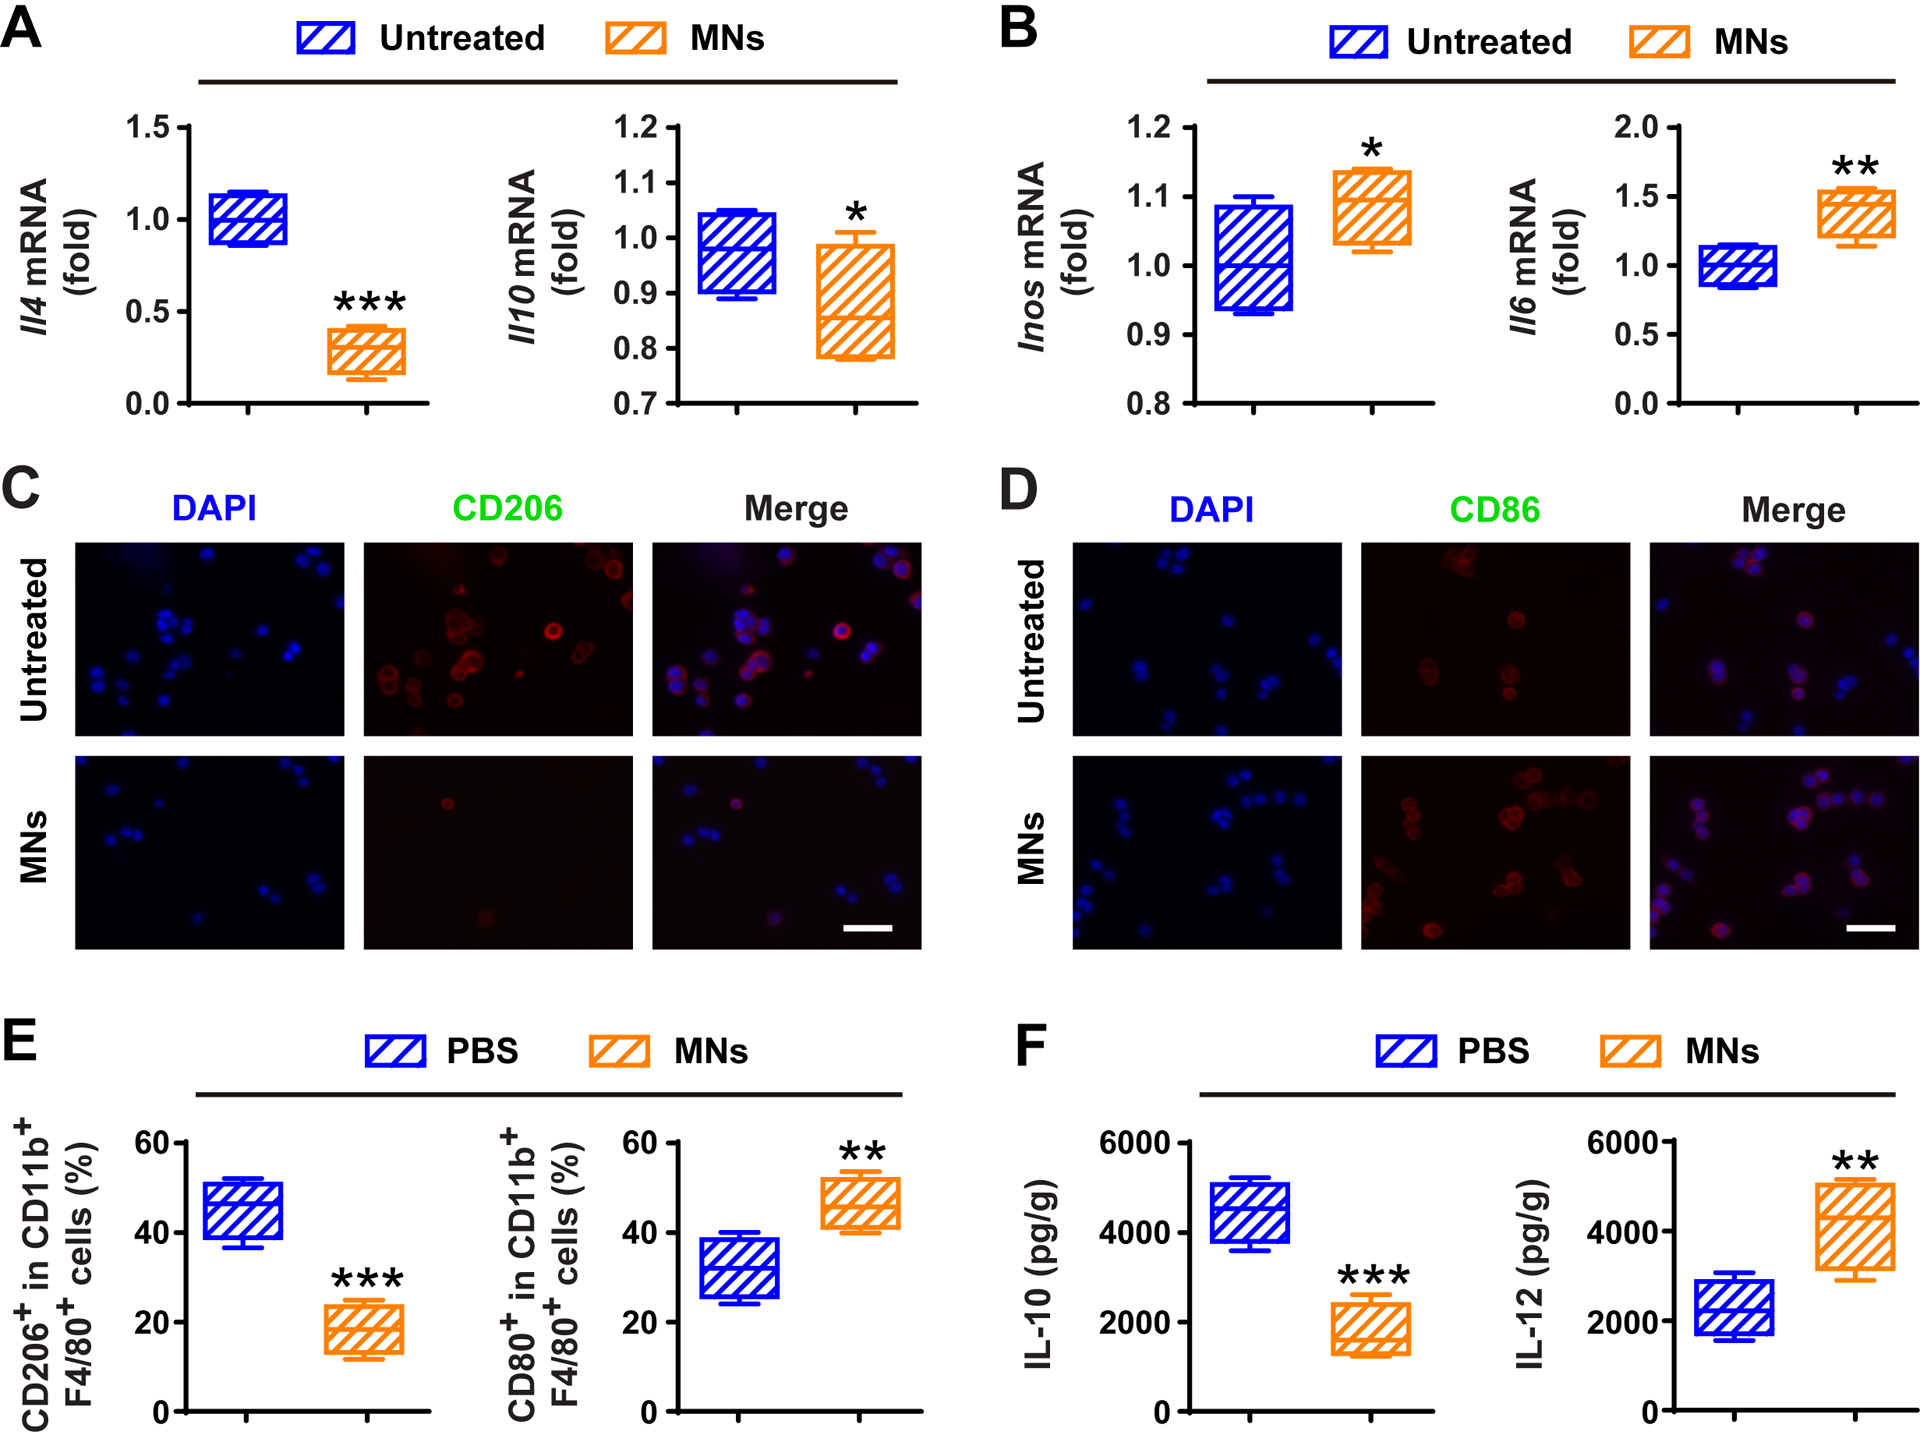
MNs alter macrophage polarization and relieve immunosuppressive tumor microenvironment in vivo. Relative mRNA expressions of A) M2 markers (i.e., IL-10 and IL-4) and B) M1 markers (i.e., IL-6 and iNOS) in M2 macrophages treated without or with MNs for 24 h. Immunofluorescence staining of C) M2 marker (i.e., CD206) and D) M1 marker (i.e., CD86) in M2 macrophages treated without or with MNs for 24 h. Scale bars, 100 μm. E) Flow cytometric analysis of CD206+ M2 TAMs and CD80+ M1 ones in tumor tissues gating on F4/80+CD11b+CD45+ cells. F) Secretion of IL-12 and IL-10 in PBS and MNs groups. All data are presented as mean ± S.D. (n = 4). Statistical significance was calculated via unpaired t test. *P < 0.05; **P < 0.01; ***P < 0.001.