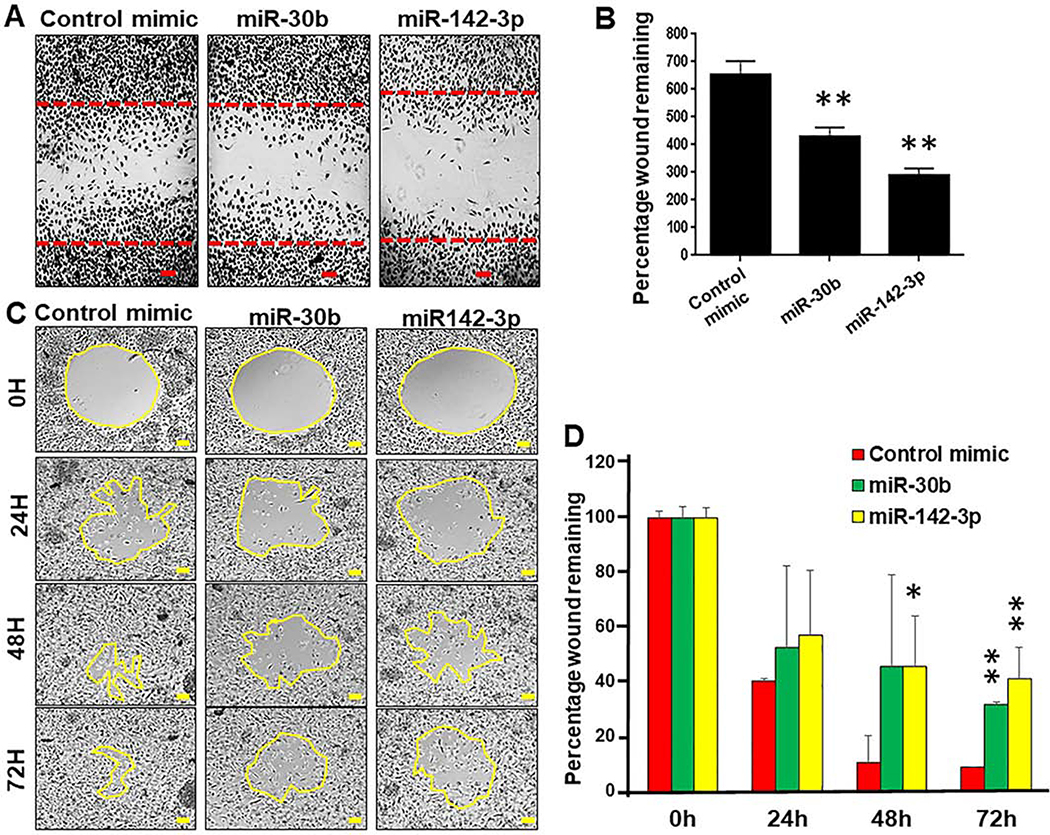
Figure 1. Macrophages transfected with miR-30b and miR-142–3p exhibit attenuated cell migration.
(A) Macrophages were transfected with miR-30b, miR-142–3p or control mimics. After 24 h, a scratch was induced and cells were monitored for 36 h. Cells were fixed, stained with H&E and imaged with light microscopy. The red lines indicate the invasive front in the wound healing assay. (B) Total number of cells counted in the migration zone after 36 h. Data are means ± SEM of three independent experiments. Student’s t-test was conducted to calculate p-values. *p<0.05, **p < 0.01. (C) Time course analysis of cell migration was performed in THP-1 macrophages transfected with miR-30b, miR-142–3p or control mimic for 24 h. The yellow lines indicate the invasive front in the wound healing assay. ImageJ analysis was performed to quantify the wound closure for 72 h. The scratched area at control (0 h) was arbitrarily assigned as 100%. (D) Cell migration assay kit was used to analyze the inhibition of cell migration in THP-1 transfected with miR-30b, miR-142–3p mimic and control mimic for 36 h. Data are means ± SEM of three independent experiments. Student’s t-test was conducted to calculate p-values. *p<0.05, **p < 0.01. Final magnification: X40, scale bar corresponds to 100 μm.

