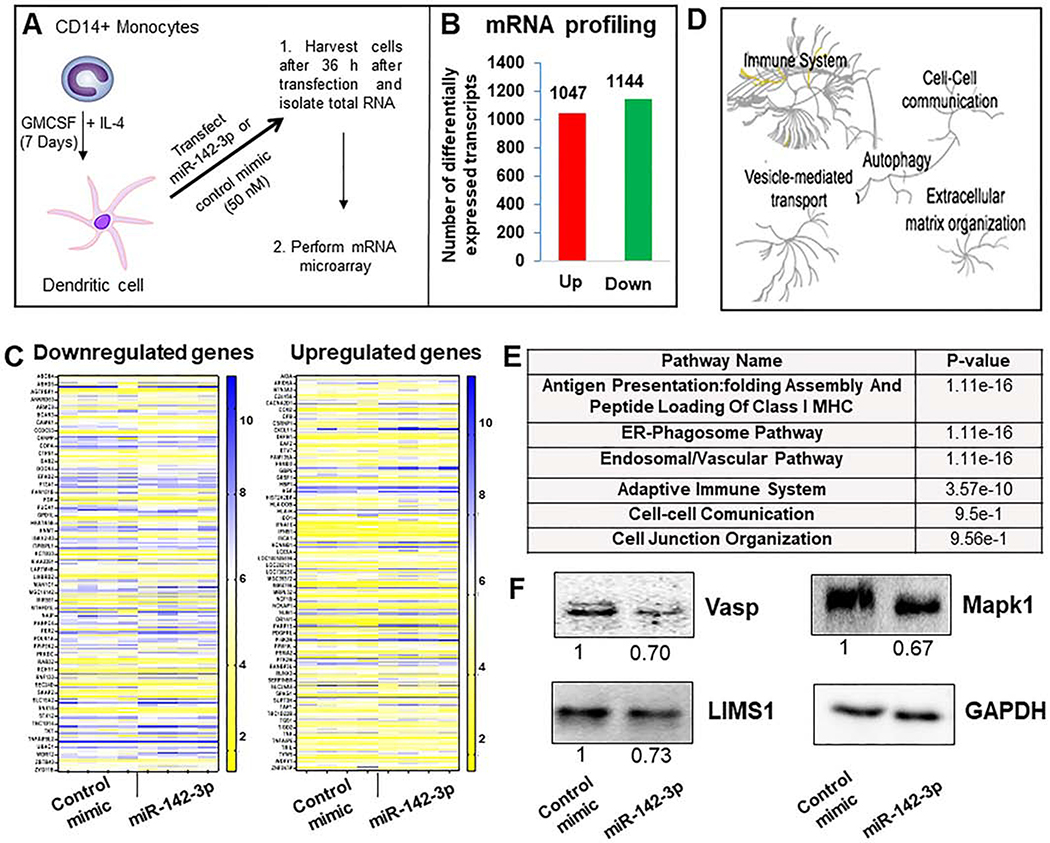
Figure 4. Transcriptome analysis of miR-142–3p overexpression in dendritic cells.
(A) Schematic graph shows as DC after 7 days of monocytes differentiation. DC are transfected with corresponding control mimic and miR-142–3p during 36 h. Thereafter, RNA was isolated and transcriptome analysis performed. (B) Number of differentially expressed upregulated and downregulated transcripts in miR-142–3p overexpressing DC compared to control mimic. (C) Heat maps showing expression profiles of downregulated and upregulated genes based on a fold change (a cut off between −1.25 and 1.25) and p value (<0.05). (D) Global pathway analysis overview by Reactome analysis. The center of each of the circular “bursts” is the root of one of a top ranked pathway. Each step away from the center represents the next level lower in the pathway hierarchy. The color code denotes over-representation of that pathway in your input dataset. Light grey signifies pathways that are not significantly over-represented. (D) Table shows several relevant pathways identified in Reactome analysis that are related to cell movement, cell adhesion and cytoskeletal rearrangement. (E) Expression of several downregulated genes in MΦ overexpressing miR-142–3p were analyzed by western blot. Day 7 differentiated cells were transfected with miR-142–3p mimic or control mimic. Cell lysates were prepared after 36 h of transfection and Vasp, LIMS1 and Mapk1 levels were detected by immunoblotting. The expression level of GAPDH was used as loading control. The corresponding densitometric analysis by Image Lab software is also shown. Data are means ± SEM of three independent experiments (*p <0.05, compared with the control mimic)

