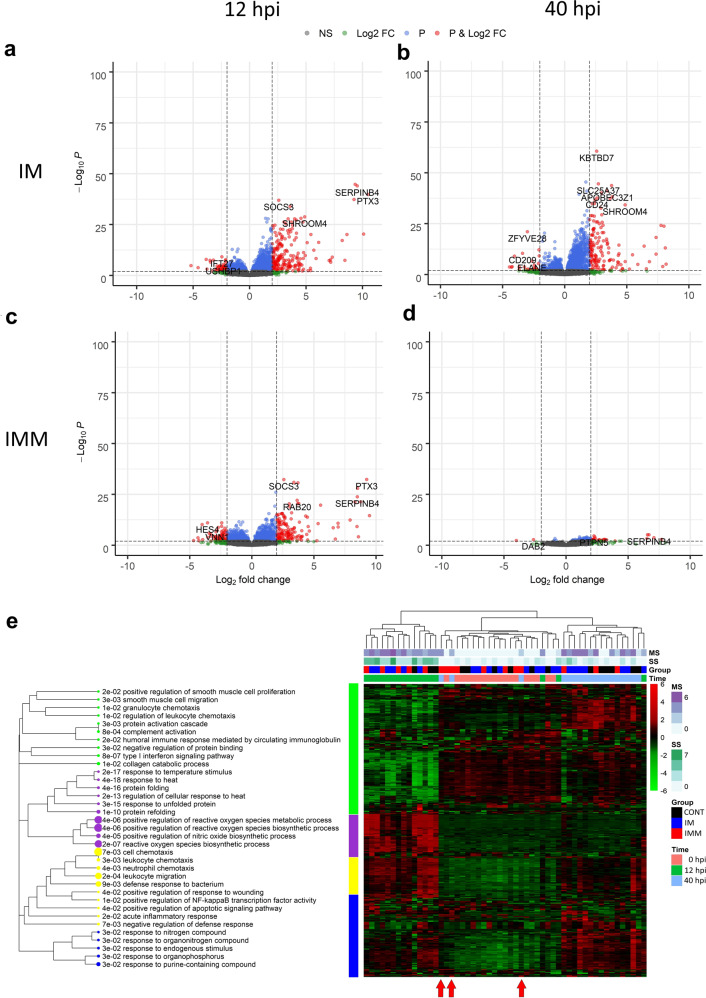
Fig. 3. Whole-blood transcriptomic analysis of the response of immunized cows during the E. coli mastitis course.
DEGs at two time points (12 and 40 hpi) in comparison with 0 hpi were identified with Deseq2. Volcano plots comparing gene expression differences between 0 and 12 hpi (a, c), and at 0 and 40 hpi (b, d) are presented for the intramuscular (IM) and the intramammary (IMM) group, respectively. Red dots correspond to genes with a q value < 0.01 and a Abslog2FoldChange > 2. e Heatmap of the top 500 DEG in control and immunized groups during the course of infection is presented. Functional analysis was performed with ToppFun and a dendrogram shows the relationship among biological functions of commonly deregulated genes according to the mammary and systemic scores, the time, and the treatment group. MS mammary score, SS systemic clinical score. Red arrows indicate IMM cows with 0 and 40 hpi profiles that were undistinguishable (further designed as cured cows).

