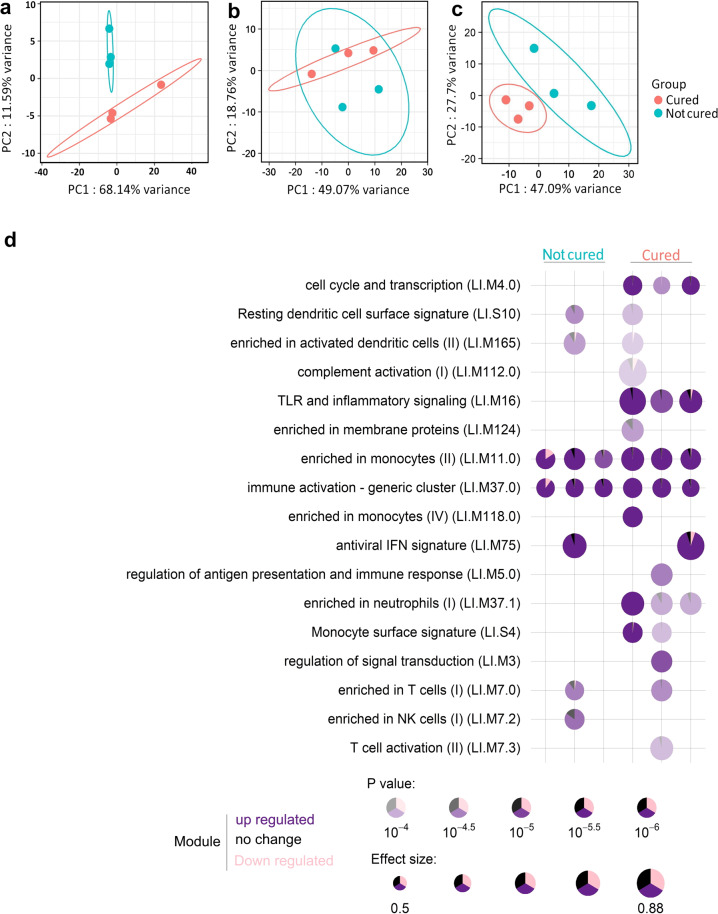
Fig. 5. Response upon the mammary booster injection and correlation with the outcome of the E. coli mammary challenge.
a A principal component analysis of gene expression profiles (top 500 most variable genes) for the intramammary-immunized IMM cows at B7. b At 12 h post infection and c and at 40 h post infection; d a modular analysis at B7 shows the difference of upregulated biological functions between cured and not cured cows (p value above 10−4).

