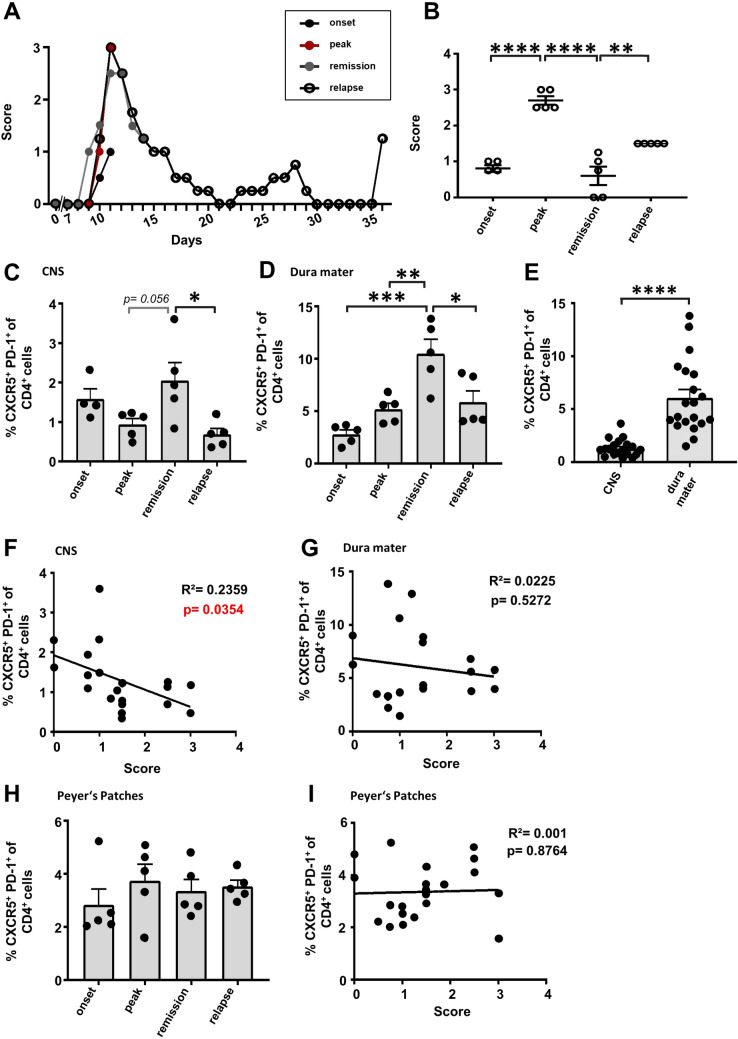
Figure 2.
Tfh cell dynamics in SJL/J EAE. EAE was induced in SJL/J mice via PLP139-151 peptide immunization. (A) EAE course mimicking relapsing–remitting disease progression, each stage represented by the disease progress of one exemplary mouse. Disease onset (average of dpi: 9–11; score range: 0.5–1.25), peak (average of dpi: 11–13; score range: 2.5–3), remission (average of dpi: 16–17; score range: 0–1.25) and relapse (average of dpi: 34–36, score range: 1–2) of the disease were defined dependent on the EAE course. The mean clinical score was compared between these different disease stages (B). (C–E) Percentage of Tfh cells (CXCR5+PD-1+) among T cells (living CD4+CD3+CD11b−CD45+ lymphocytes) were compared between the defined disease stages in the CNS (C) and dura mater (D). In addition, pooled Tfh frequencies on different time points (onset, peak, partial remission and relapse) of CNS and dura mater were compared (E). Data shown are mean ± SEM (C–E). (F, G) Correlation analysis between the percentage of Tfh cells and the clinical score of the CNS (F) and the dura mater (G). (H, I) Analysis of the Tfh frequency (H) and the correlation analysis (I) in the Peyer’s patches. Results are representative of two independent experiments. Statistical analysis was performed using one-way ANOVA followed by Tukey’s multiple comparison test (B–E, H) or linear regression (F, G, I). *p < 0.05; **p < 0.01; ***p < 0.001; ****p < 0.0001. Onset n = 4, peak n = 5, remission n = 5, relapse n = 5.

