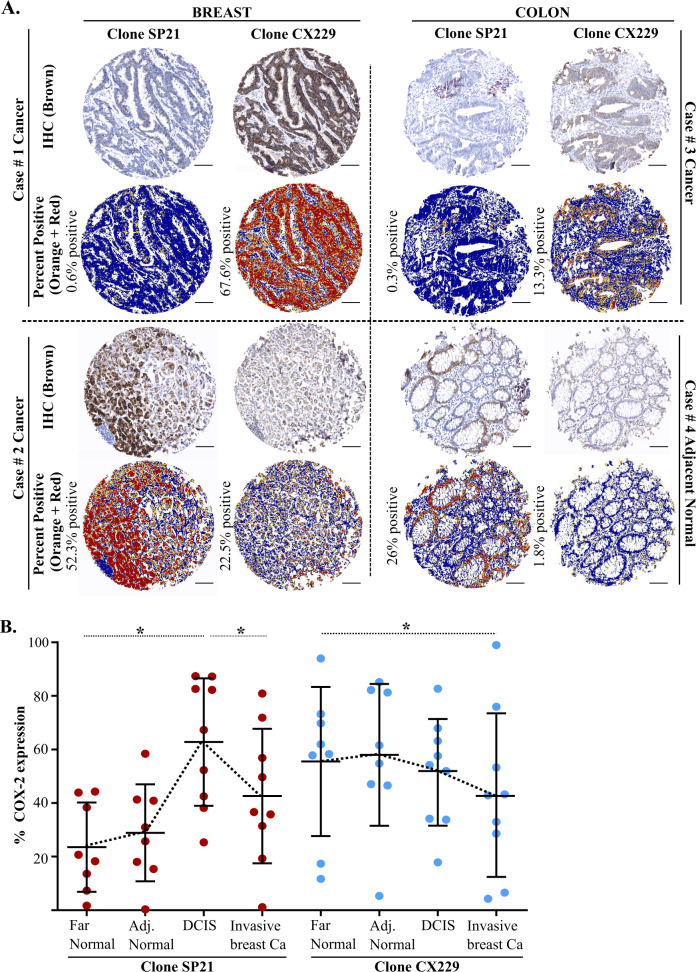
Fig. 3. Two αCOX2 clones show differential pattern of staining.
A TMA cores from breast and colon cancer cases show preferential CX229 (cases #1 and #3) or preferential SP21 staining (cases #2 and #4). Algorithmic analysis for each TMA core shows COX2 positive signal (orange and red) compared to negatively stained tissue (blue). B Sequential sections of individual cases were stained for SP21 (red) and CX229 (blue), and evaluated for COX2 expression in far and adjacent normal, DCIS, and invasive breast cancer tissue (n = 9). SP21 shows highest expression in the DCIS lesions. Clone CX229 shows highest COX2 expression in normal far and adjacent breast epithelium, with decreased COX2 expression in invasive cancer (*P values: ≤ 0.05). Scale bar for all images is 100 µm.

