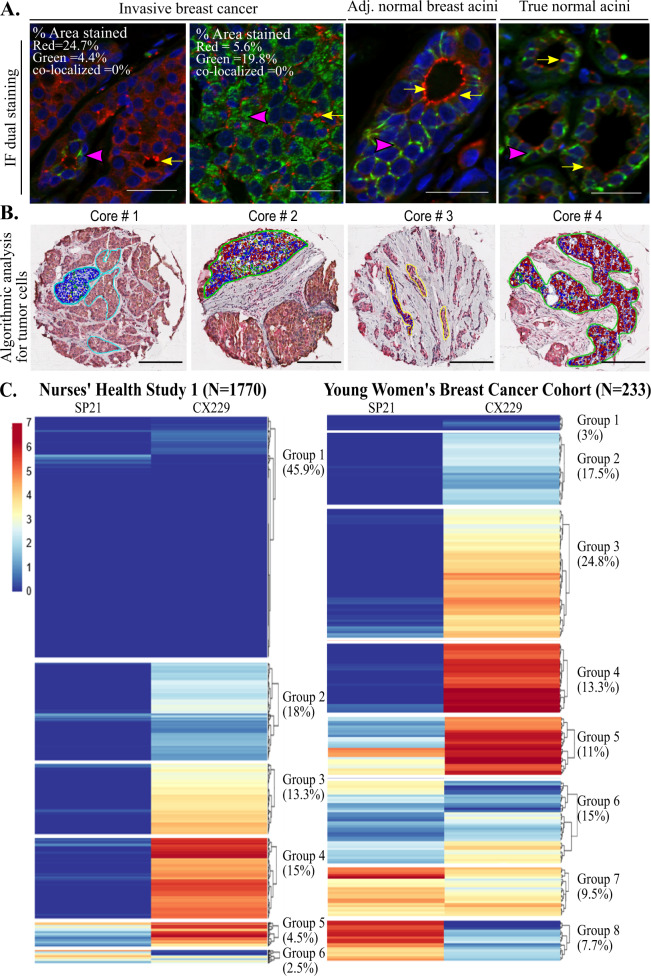
Fig. 4. Variation of SP21 and CX229 expression in two breast cancer cohorts.
A IF staining of two invasive cancer cases show predominant staining for either SP21 (far left panel) or CX229 (left middle panel) and absence of colocalization (SP21 = red, CX229 = green, and colocalization = yellow). Percent stained area for each clone and percent colocalization are listed within the images. Similarly, IF staining of adjacent normal (right middle panel) and true normal (far right panel) breast acini show SP21 (red signal) and CX229 (green signal) stain distinct cellular locations with minimal overlap (yellow signal). Pink arrow heads show intense localized staining for CX229. Yellow arrows show intense localized staining for SP21. Scale bar = 20 µm. B TMA cores with dual staining for SP21 and CX229 were annotated for tumor epithelium. The algorithmic analyses of positive staining for SP21 (red), CX229 (green), colocalization (yellow), and negative (blue) is shown. Scale bar is 100 µm. C Hierarchical clustering analysis for SP21 and CX229, assessed independently for each breast cancer cohort using RStudio, shows cohorts separate into distinct groups. NHS1 breast tumor cores (N = 8612, 1770 cases) clustered into six COX2 expression groups with the largest group (n = 3961, 45.9%), exhibiting very low expression for both SP21 and CX229. Groups 2 (n = 1580, 18%), 3 (n = 1154, 13.3%), and 4 (n = 1308, 15%), were defined by cores with low, medium, and high expression of CX229, respectively, and very low SP21 expression. Cluster 5 (n = 389, 4.5%) had medium level of SP21 expression and high CX229 expression, and cluster 6 (n = 220, 2.5%) contained cores with medium expression of SP21, but low expression of CX229 (left panel). The young women breast cancer study clustered into eight groups with cluster 1 (n = 7, 1.8%) with very low expression of both SP21 and CX229. Groups 2 (n = 34, 17.5%), 3 (n = 58, 24.8%), and 4 (n = 31, 13.3%) had very low SP21 and low, medium, and high CX229 expression, respectively. Groups 5 (n = 26, 11%) and 6 (n = 37, 15%) had high and low CX229 expression, respectively, with low to medium SP21 expression. Groups 7 (n = 22, 9.5%) and 8 (n = 18, 7.7%) had medium to high SP21 and low CX229 expression (right panel).

