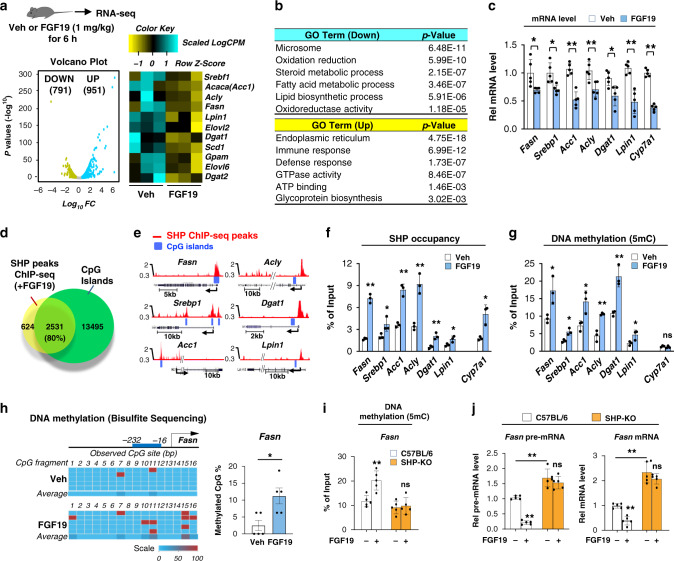
Fig. 2. SHP occupancy and DNA methylation are increased at lipogenic genes after FGF19 treatment.
a–c C57BL/6 mice were treated with vehicle or FGF19 for 6 h after fasting overnight. a, b Total RNA was isolated from mouse liver and analyzed by RNA-seq. a A volcano plot showing genome-wide changes in mRNA level (left) and a heatmap of the differential expression of lipogenic genes in mice treated with vehicle or FGF19 (right). b Selected biological pathways increased or decreased by FGF19 treatment as determined by gene ontology (GO) analysis. c Relative mRNA levels of selected lipogenic genes measured by RT-qPCR. d Venn diagrams showing the numbers of SHP binding peaks increased by FGF19 treatment of mice for 2 h in hepatic chromatin using published ChIP-seq data18 and the numbers of CpG islands. e Normalized SHP binding peaks (Red) and CpG islands (Blue) at selected lipogenic genes displayed using the UCSC genome browser. f, g C57BL/6 mice were treated with vehicle or FGF19 for 2 h. f SHP occupancy or g DNA methylation at promoters of the indicated lipogenic genes determined by ChIP or MeDIP, respectively. h DNA methylation at specific sites of Fasn promoter determined by bisulfite sequencing. i, j C57BL/6 and SHP-KO mice were treated with vehicle or FGF19 for 2 h (i, j-left) or 6 h (j-right). i DNA methylation determined by MeDIP at hepatic Fasn and j hepatic pre-mRNA and mRNA levels. c, f-j The mean and standard deviation are plotted (n = 5). Data presented as mean values ± SD are shown (c, h-j, n = 5 mice; f, g, n = 3 mice), and statistical significance was determined by (c, f–h) two-tailed Student’s t-test or (i, j) two-way ANOVA with the Tukey post-test. *P < 0.05, **P < 0.01, ns, statistically not significant. In b, exact p-values are produced by DAVID v6.8 program (https://david.ncifcrf.gov/) which are computed by summing probabilities p over defined sets of tables (Prob = ∑Ap).

