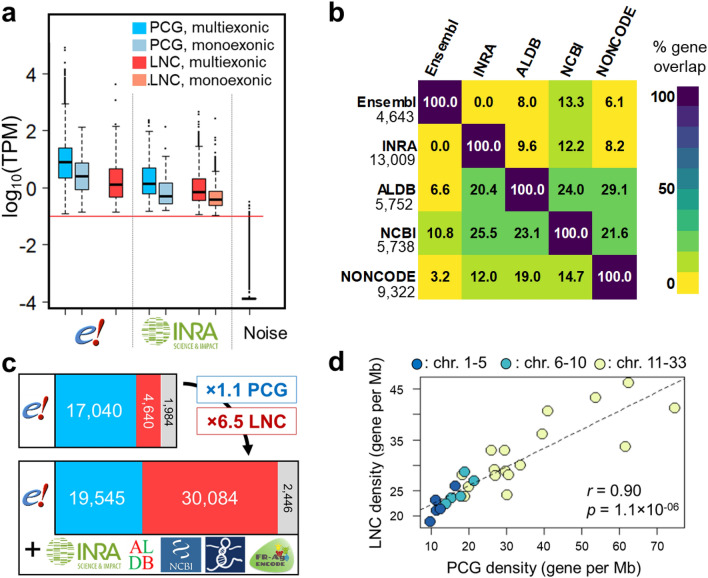
Figure 1.
Extended gene catalogue features. (a) Expressions of the newly modelled genes compared to expression of the Ensembl genes and background noise, here given in the liver. The red line corresponds to the 0.1 TPM threshold. (b) Heatmap of the overlap between databases expressed in % of LNC (in line) shared among databases (in column), using 1 bp-or-more overlap. The number of LNC per database is mentioned in line. (c) The extended catalogue gathers 6.5 × more lncRNA genes and 1.1 × more PCG compared to Ensembl alone. (d) Correlation of LNC gene density to protein-coding gene density across the chicken macro-, medium- and micro-chromosomes. TPM: Transcript Per Million, chr: chromosome, Mb: Megabase.

