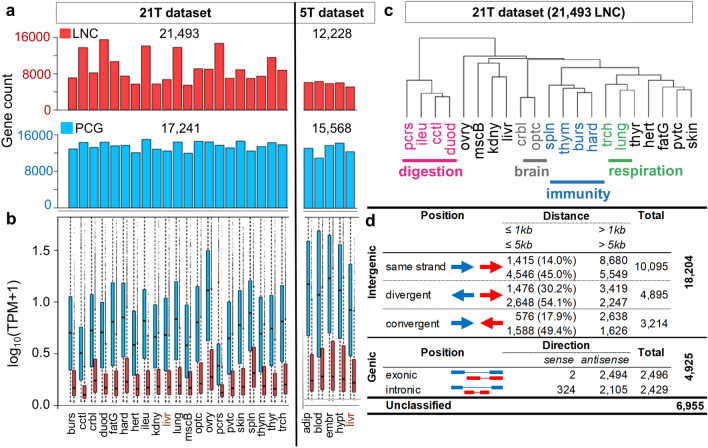
Figure 2.
Overview of the extended catalogue in terms of expression and genomic configuration. (a) Number of LNC (red) and PCG (blue) expressed in each tissue: in the 21 T dataset, were expressed between 11,963 (muscle) and 14,983 (ileum) PCG with a median of 13,691 and between 5,492 (kidney) and 15,534 (duodenum) LNC with a median of 8794. In the 5 T dataset, were expressed between 11,024 (blood) and 14,313 (hypothalamus) PCG with a median of 13,165 and between 5127 (liver) and 6,319 (blood) LNC with a median of 6,043. (b) Boxplot of expression levels of LNC (red) and PCG (blue) in each tissue. (c) Hierarchical clustering of the 21 tissues from the 21 T dataset based on 21,493 LNC expressed in at least one tissue. Clustering performed using “1—Pearson correlation” distance and “ward” aggregation criteria. (d) Overview of the classification of LNC genes with respect to their closest PCG. For each configuration, the first line shows the numbers for a 1 kb threshold and the second line for a 5 kb threshold. Abbreviations in panels (a–c) stand for: burs: bursa of Fabricius, cctl: cecal tonsils, crbl: cerebellum, duod: duodenum, fatG adipose tissue around the gizzard, hard: harderial gland, hert: heart, ileu: ileum, kdny: kidney, livr: liver, lung: lung, mscB breast muscle, optc: optical lobe, ovry: ovary, pcrs: pancreas, pvtc: proventriculus, skin: skin, spln: spleen, thym: thymus, thyr: thyroid gland, trch: trachea.

