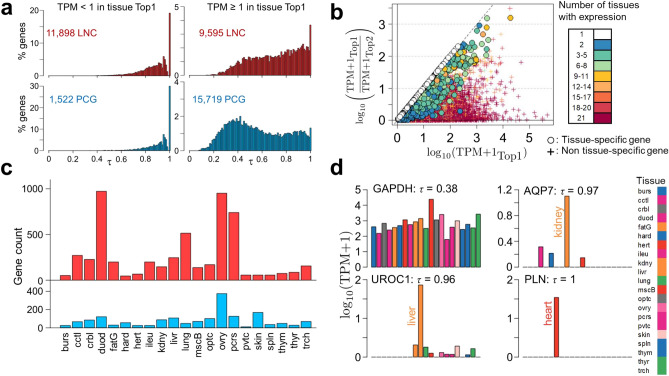
Figure 5.
Overview of the tissue-specificity of PCG (in blue) and LNC (in red) in the 21 T dataset. (a) Distribution of τ values for LNC (top row) and PCG (bottom row) for two expression levels: TPM < 1 (left column) and TPM ≥ 1 (right column). The total number of corresponding genes is indicated in each plot. (b) For all the expressed genes (LNC and PCG), ratio of expression between the tissue with the highest expression (“Top1”) and the second tissue with highest expression (“Top2”) as a function of the expression in the tissue Top1. Colour indicates the number of tissues in which each gene is expressed, and the shapes differentiate the genes with a τ ≥ 0.95 (dots) versus τ < 0.95 (crosses). (c) Number of LNC (red) and PCG (blue) which are tissue-specific (τ ≥ 0.95) in each of the 21 tissues. (d) Expression profiles of 4 genes: the ubiquist GAPDH (top left), the tissues-specific AQP7 and UROC1 (top right and bottom left) and the heart-exclusive PLN (bottom right), expressed only in the heart. Tissues abbreviations are the same as in Fig. 2.

