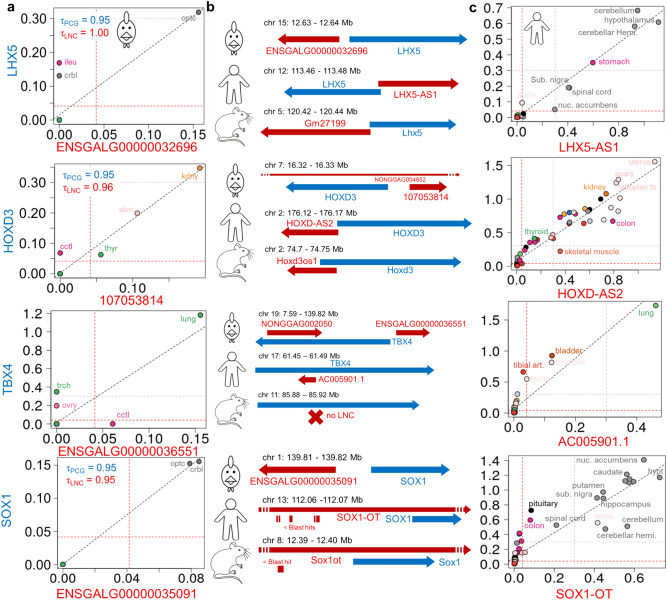
Figure 6.
Tissue expression in chicken (a) and human (c) for 4 LNC:PCG pairs with similar genomic configurations between the two species (b). (a) Log10(TPM + 1) expression of the LNC (X-axis) and the PCG (Y-axis) (top) for chicken across the 21 tissues of the 21 T dataset for the four chicken divergent pairs for which both members are tissue-specific in the same tissue. (b) Genomic configuration in three species of the LNC:PCG pairs. In red the LNC, in blue the PCG. For the LNC:SOX1 pair, were added the positions of hits (in minus strand) resulting in the mapping of ENSGALG00000035091 chicken LNC sequences to human and mouse genome on the opposite strand. (c) Expression in log10(TPM + 1) of LNC:PCG pairs in 53 human tissues using the GTEx data. Tissues abbreviations are the same as in Fig. 2.

