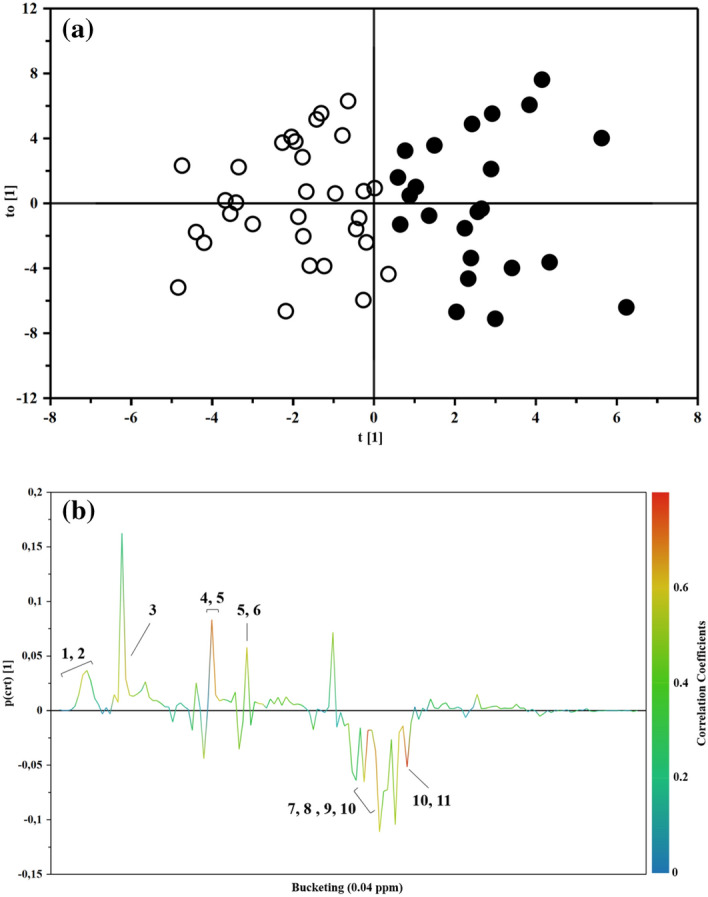
Figure 1.

(a) OPLS-DA scores plot of 1H-NMR spectra of plasma samples: Controls (full circle), IEI-EMF subjects (open circle). (b) Color-coded coefficient loadings plot of metabolomics profile between Controls and IEI-EMF subjects. Peaks: 1 and 2, 2-hydroxyisocaproate and Isoleucine; 3, Lactate; 4 and 5, Homoserine and Glutamine; 5 and 6, Glutamine and Pyroglutamate; 7, 8, 9 and 10, Glutamine, Glycine, Myo-inositol and Choline; 10 and 11, Serine and Choline.
