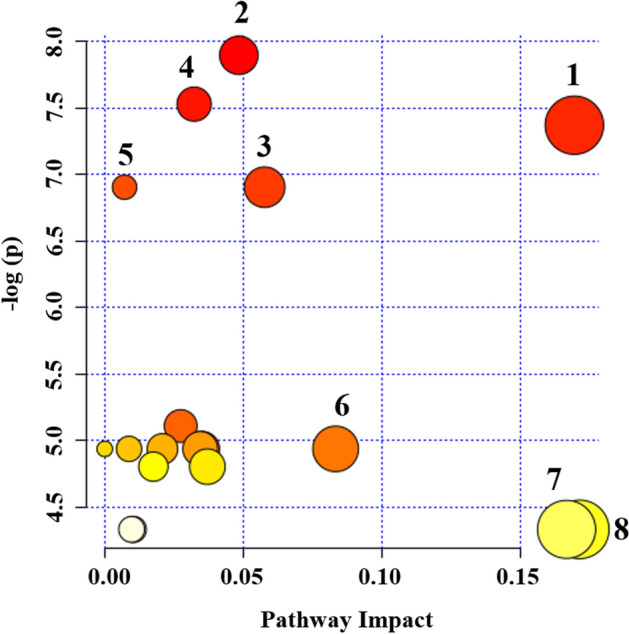
Figure 4.

Summary of pathway analysis of IEI-EMF group compared to Controls. Plot was obtained by using MetaboAnalyst 4.0. “X axis” represents the impact of the identified metabolites on the indicated pathway. “Y axis” indicates the extent to which the designated pathway is enriched in the identified metabolites. Circle colors indicate pathway enrichment significance. Circle size indicates pathway impact. 1, Glycine, serine and Threonine metabolism; 2, Aminoacyl-tRNA biosynthesis; 3, Nitrogen metabolism; 4, Glutathione metabolism; 5, Purine metabolism; 6, Cyanoaminoacid metabolism; 7, Alanine, aspartate and glutamate metabolism and 8, d-glutamine and d-glutamate metabolism.
