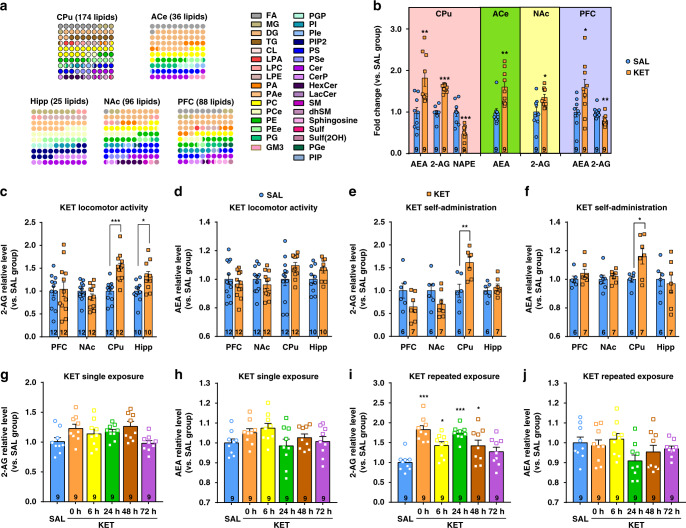
Fig. 1. 2-AG level in the dorsal striatum is significantly elevated by ketamine.
a Ketamine alters the lipid composition of brain in mice. Dot-plot graphic was adopted to exhibit the altered lipid subclass. The color of the dots represents a lipid subclass and the quantity of the dots represents the percentage. The lipids of CPu showed the most obvious alterations with 174 modified lipids. b Endocannabinoids changed significantly in the brain. The lipid level was normalized automatically by QI software and recalculated the relative levels compared to the saline control group (unpaired two-tailed t test, AEA in CPu t(16) = 3.562, P = 0.0026; 2-AG in CPu t(16) = 9.877, P < 0.0001; NAPE in CPu t(16) = 4.413, P = 0.0004; AEA in ACe t(16) = 3.678, P = 0.002; 2-AG in NAc t(16) = 2.558, P = 0.0211; AEA in PFC t(16) = 2.264, P = 0.0378; 2-AG in PFC t(16) = 3.239, **P = 0.0051). c Ketamine (15 mg/kg) significantly elevated 2-AG level both in the CPu and hippocampus of mice under hyperlocomotion paradigm (unpaired two-tailed t test, t(22) = 4.805, P < 0.0001; t(18) = 2.666, P = 0.0158). d Ketamine (15 mg/kg) did not change the AEA level in the brain of mice under hyperlocomotion. e Ketamine self-administration (0.5 mg/kg/infusion) significantly elevated 2-AG level in the CPu (unpaired two-tailed t test, t(11) = 3.378, P = 0.0062). f Ketamine self-administration (0.5 mg/kg/infusion) significantly increased AEA level in the CPu (unpaired two-tailed t test, t(11) = 2.626, P = 0.0236). g, h The levels of 2-AG and AEA were not altered after single ketamine exposure (15 mg/kg). i 2-AG level was significantly increased after repeated ketamine exposure (15 mg/kg; one-way ANOVA, followed by Dunnett’s multiple comparisons test, F(5,48) = 9.109, P < 0.0001; 0 h vs. SAL, P < 0.0001; 6 h vs. SAL, *P = 0.0187; 24 h vs. SAL, P < 0.0001; 48 h vs. SAL, P = 0.0207). j AEA level was not altered after repeated ketamine exposure (15 mg/kg). Data are shown as mean ± SEM. Compared to SAL group, *P < 0.05, **P < 0.01, ***P < 0.001. SAL saline, KET ketamine, ACe central amygdaloid nucleus, CPu caudate nucleus and putamen, NAc nucleus accumbens, PFC prefrontal cortex, Hipp hippocampus, FA fatty acid, MG monoacylglycerol, DG diacylglycerol, TG triacylglycerol, CL cardiolipin, LPA lysophosphatidic acid, LPC lysophosphatidylcholine, LPE lysophosphatidylethanolamine, PA phosphatidic acid, PAe ether phosphatidic acid, PC phosphatidylcholine, PCe ether phosphatidylcholine, PE phosphatidylethanolamine, PEe ether phosphatidylethanolamine, PG phosphatidylglycerol, GM3 monosialodihexosylganglioside, PGP phosphatidylglycerol phosphate, PI phosphatidylinositol, PIe ether phosphatidylinositol, PIP2 phosphatidylinositol bisphosphate, PS phosphatidylserine, PSe ether phosphatidylserine, Cer ceramide, CerP ceramide 1-phosphate, HexCer hexosylceramide, LacCer lactosylceramide, SM sphingomyelin, dhSM dehydrosphingomylin, Sulf sulfatides, Sulf(2OH) 2-hydroxy N-acyl sulfatide, PGe ether phosphatidylglycerol, PIP phosphatidylinositol phosphate. Source data provided as a Source Data file.

