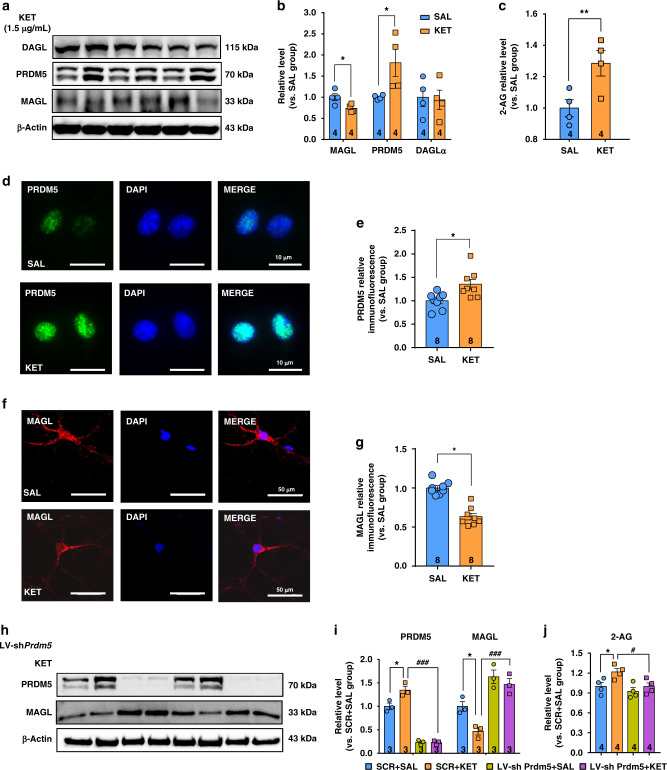
Fig. 7. Ketamine increases the 2-AG level in the primary cultured SPNs.
a, b Ketamine decreased MAGL expression (unpaired two-tailed t test, t(6) = 2.732, P = 0.0341) but increased PRDM5 expression in the cultured SPNs (unpaired two-tailed t test, t(6) = 2.527, P = 0.0449). Ketamine did not affect DAGL expression (unpaired two-tailed t test, t(6) = 0.1882, P = 0.8569). c Ketamine increased the 2-AG level in the cultured SPNs (unpaired two-tailed t test, t(6) = 2.951, P = 0.0256). d Representative immunofluorescent images of PRDM5 (green) and DAPI (blue). e Ketamine increased PRDM5 expression (unpaired two-tailed t test, t(14) = 2.89, P = 0.0119). f, g Representative immunofluorescent images of MAGL (red) and DAPI (blue). Ketamine decreased MAGL expression (unpaired two-tailed t test, t(14) = 7.16, P < 0.0001). Compared to SAL group, *P < 0.05, **P < 0.01. h, i LV-shPrdm5 restored MAGL expression downregulated by ketamine (one-way ANOVA, followed by Dunnett’s multiple comparisons test: PRDM5 F(3,8) = 95.58, P < 0.0001; VEH + KET vs. VEH + SAL, P = 0.0071, VEH + KET vs. LV-shPrdm5 + KET, P < 0.0001; MAGL F(3,8) = 20.09, P = 0.0004; VEH + KET vs. VEH + SAL, P = 0.0299, VEH + KET vs. LV-shPrdm5 + KET, P = 0.0008). j LV-shPrdm5 reversed ketamine-elevated 2-AG level (one-way ANOVA, followed by Dunnett’s multiple comparisons test, F(3,12) = 5.395, P = 0.0139; VEH + KET vs. VEH + SAL, P = 0.0386, VEH + KET vs. LV-shPrdm5 + KET, P = 0.0364). Compared to SCR + SAL group, *P < 0.05; compared to SCR + KET group, #P < 0.05, ###P < 0.001. Data are shown as mean ± SEM. SAL saline, KET ketamine. Source data provided as a Source Data file.

