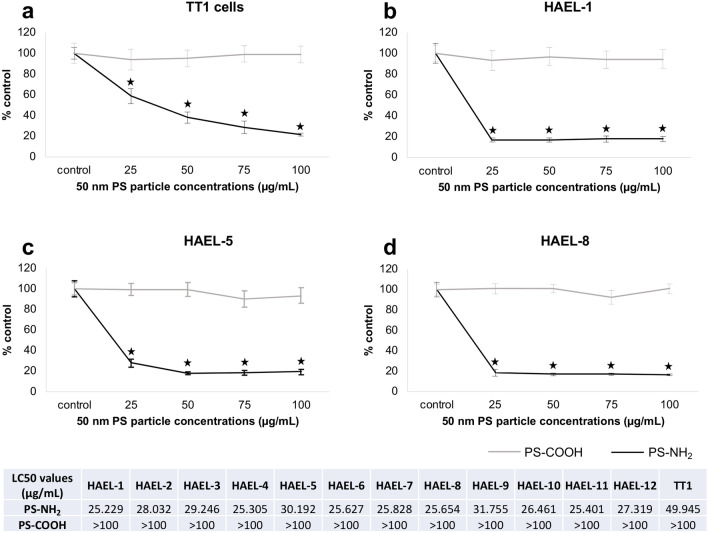
Figure 8.
Cell viability (MTT assay) of TT1 cells (a) and ICs (b–d) exposed to 50 nm PS-NH2 and PS-COOH particles for 24 h. Data are given as percentage with respect to controls (means ± SD). Stars indicate significant differences (p < 0.05) in treated cells with respect to controls according to the Kruskal–Wallis followed by the Dunn’s post hoc test. n = 6 replicates per treatment. LC50 values were calculated through Probit analysis.

