Figure 4.
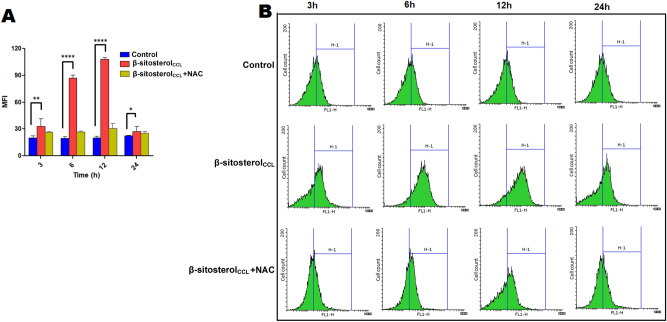
Measurement of intracellular ROS generation in L. donovani promastigotes. ROS generation was monitored by flow cytometry using H2DCFDA at 3 h, 6 h, 12 h and 24 h. Elevated ROS level in β-sitosterolCCL-treated parasites was observed compared to the control, whereas ROS generation in NAC-pre-treated promastigotes was found to be restrained to the level in control cells at each time point. Comparison of ROS generation in untreated, β-sitosterolCCL (IC50 dose)-treated and NAC (20 mM)-pre-treated promastigotes at different time points are represented in both the bar graph and histogram. (A) The bar graph is representative of three independent experiments, and statistical significance is calculated compared to the untreated control set by using one-way ANOVA with Dunnett's multiple comparison test, where *p < 0.05, **p < 0.01 and ****p < 0.0001 are considered statistically significant. (B) Histograms depict the shift of MFI as indicated by the H-1 region. Data were acquired in a BD FACSCalibur flow cytometer and analysed in Flowing software (https://www.flowingsoftware.com), version 2.5.1, Finland.

