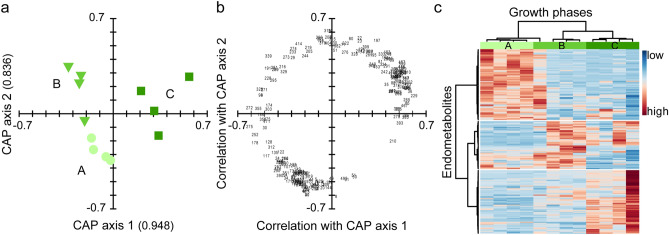
Figure 2.
Endometabolic changes of Phaeocystis pouchetii AJ01 during growth in laboratory batch cultures (n = 4). Separation is based on canonical analysis of principal coordinates (CAP); axis eigenvalues are given in parentheses. (a) Score plot of the growth phases: exponential phase ('exp', bright green circle), early stationary phase ('e.stat', green triangle), late stationary phase ('l.stat', dark green square). (b) Loading plot (scaled to score plot) of correlated endometabolites (> 0.708) depicted with their identifier as tabulated in the Supplementary Table S6. (c) Heat map of correlated endometabolites (analyte peak area/peak sum) indicating low (blue) or high (red) relative concentrations in the growth phases. Metabolites and samples are clustered hierarchically for better visualization using the Pearson distance measure and Ward cluster algorithm.

