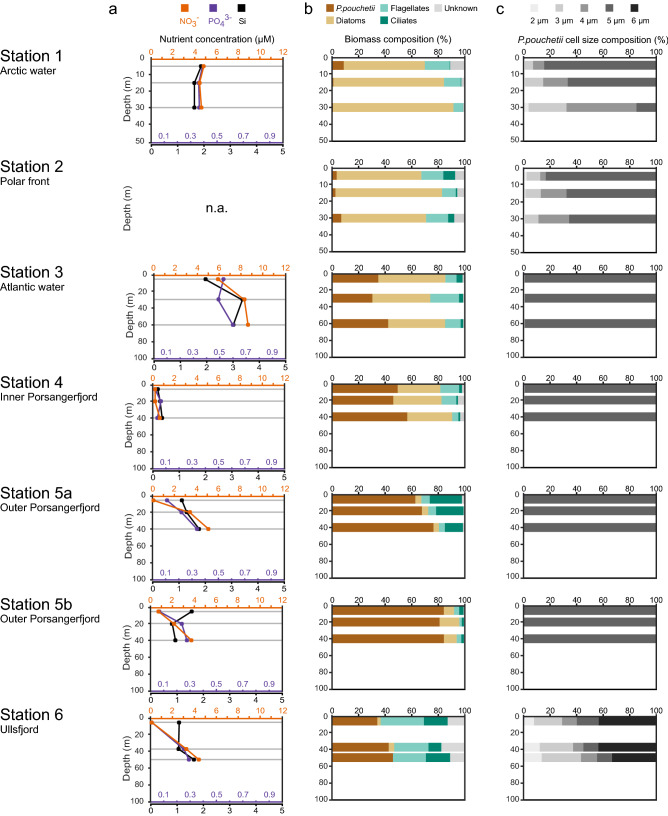
Figure 3.
PHAEONIGMA cruise metadata of stations sampled along a transect in the Barents Sea (Station 1–3) and in North Norwegian fjords (Station 4–6). The geographic location of the cruise station is given in Fig. 5a. (a) Depth profiles of dissolved inorganic nutrient concentrations (µmol L−1) of nitrate (orange), phosphate (violet), and silicate (black). (b) Biomass proportion (% mg C m−3) of phytoplankton taxa classified as 'Phaeocystis pouchetii', 'diatoms', 'flagellates', 'ciliates', and 'unknown'. (c) Biomass proportion (% mg C m−3) of different cell sizes of P. pouchetii ranging from 2 µm (light grey) to 6 µm (dark grey). Phytoplankton community characteristics were determined by microscopy (for absolute numbers see Supplementary Table S7). Grey horizontal lines represent the sampling depths above, at and below the Chl a maximum for metabolite profiling. n.a. not available.

