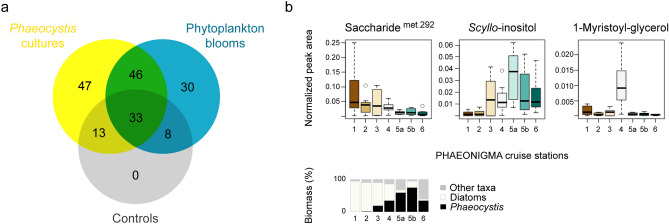
Figure 4.
Occurrence of Phaeocystis pouchetii endometabolites within natural phytoplankton communities of the Barents Sea and North Norwegian fjords. (a) Venn diagram of unique and shared metabolites between P. pouchetii laboratory cultures (n = 12), natural phytoplankton communities (n = 58), and controls (n = 7). (b) Box-Whisker plots showing abundance of selected shared metabolites (as peak area/peak sum) at Barents Sea (1–3) and North Norwegian fjord stations (4–6; n = 8–9, averaged over all depths). The geographic locations of the cruise stations are depicted in Fig. 5a. The depicted metabolites are representative for three occurrence patterns: diatom dominance (station 1–3), Phaeocystis dominance (station 5–6), and nutrient depletion (station 4) as indicated by the relative biomass of phytoplankton taxa at the respective sites.

