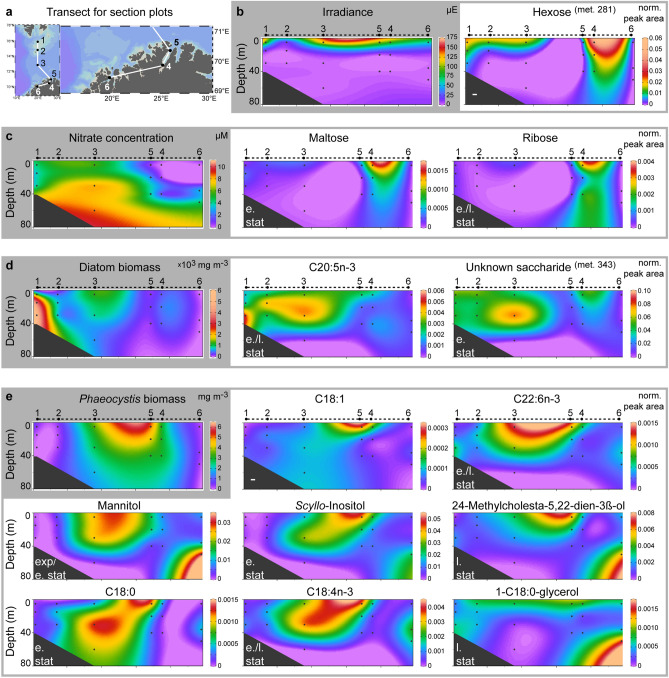
Figure 5.
Relative abundance of P. pouchetii endometabolites within phytoplankton communities in the Barents Sea and North Norwegian fjords. (a) Transect along the PHAEONIGMA cruise stations 1–6 as used for section plots. (b–e) Section plots of metabolites that can be linked to species composition and environmental parameters (shaded in grey). Metabolites with similar occurrence patterns are grouped in grey boxes. 'Met.'—metabolite identifier within laboratory dataset. The growth phase of highest abundance for each metabolite is indicated (exp—exponential, e.stat—early stationary, l.stat—late stationary). The station map and section plots were generated using Ocean Data View (version 4.7.10, https://odv.awi.de).

