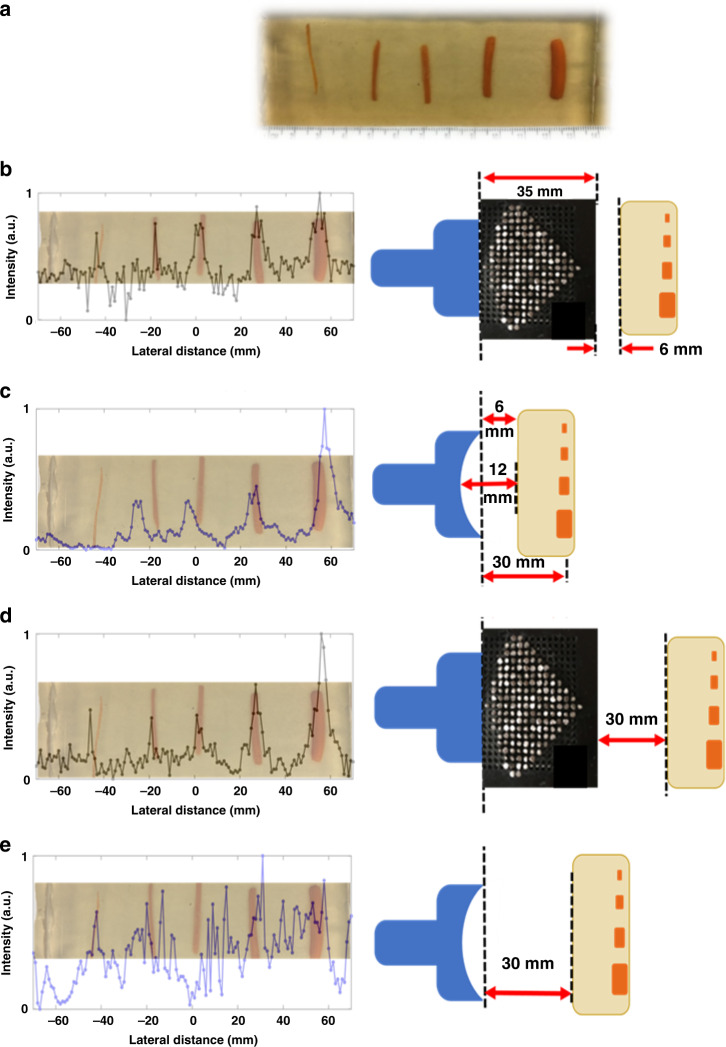
Fig. 7. Comparison between a focused transducer and the ML both at and beyond the focal zone.
a Samples of carrot tissue ranging from 1.5 mm (left) to 6 mm (right) in width. Scan with carrot tissue at the focal length of the focused transducer for the ML (b) and focused transducer (c). Scan with carrot tissue in the Fresnel transition zone of the unfocused transducer for the ML (d) and focused transducer (e). Comparative acuity of ML vs. focused transducer at (b, c) and beyond (d, e) the transducer focal length. Scans were performed monostatically with carrots at average depth of 15 mm in the tissue.

