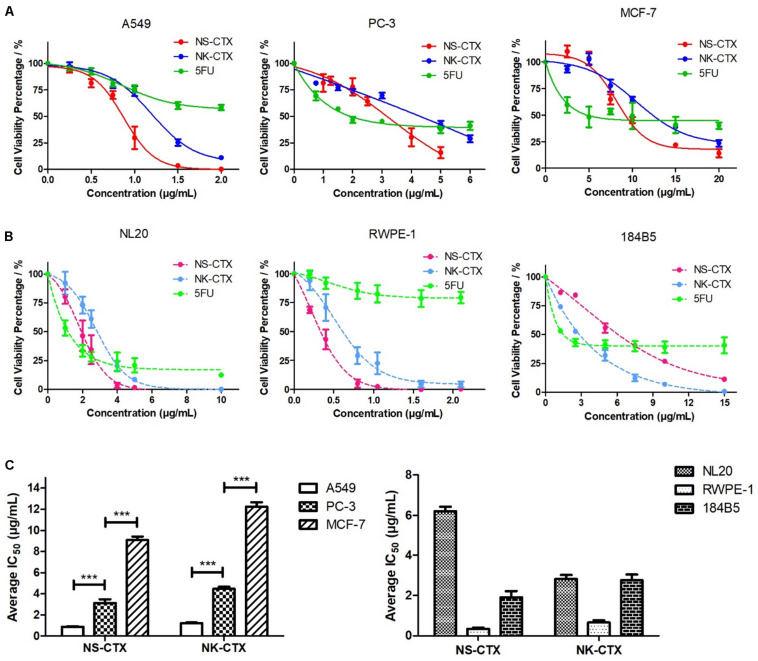
FIGURE 4.
Cytotoxicity of NS-CTX, NK-CTX, and 5-fluorouracil (5FU) on cancer and normal cell lines. (A) Cell viability plot for cancer cell lines (A549, PC-3, and MCF-7). (B) Cell viability plot for normal cell lines (NL20, RWPE-1, and 184B5). (C) Half maximal inhibitory concentrations (IC50) of cell lines treated with NS-CTX and NK-CTX. All assays involved three technical and biological triplicates. One-way ANOVA with Bonferroni post hoc test was used to determine statistical significance across three cancer cell lines (*** indicates p < 0.001).

