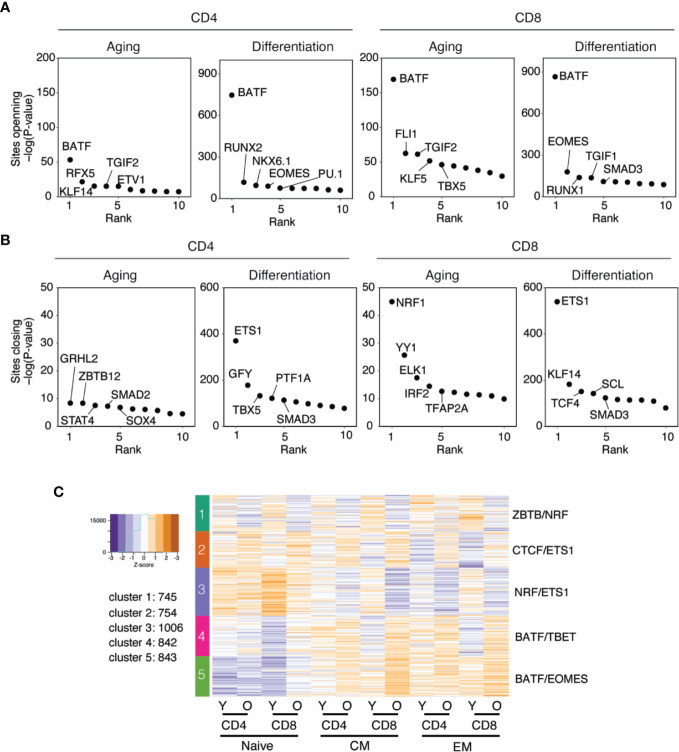
Figure 3.
Transcription factor networks in T cell aging and differentiation. (A, B) TF motif enrichments at sites more (3A) or less accessible (3B) with age and differentiation in CD4 (left) and CD8 (right) T cells are compared. X-axis shows the rank of the TFs, y-axis the significance level of TF motif enrichment (C) k-means analysis of sites differentially accessible with age as defined in Figures 2A, B . The number of clusters was determined by gap statistics, and results are shown as heat plots with each horizontal line representing a differentially open site (left). Columns represent CD4 and CD8 T cell subsets and colors z-scores of openness. Top transcription factor motifs significantly enriched at the sites within each cluster are indicated at the right margin.

