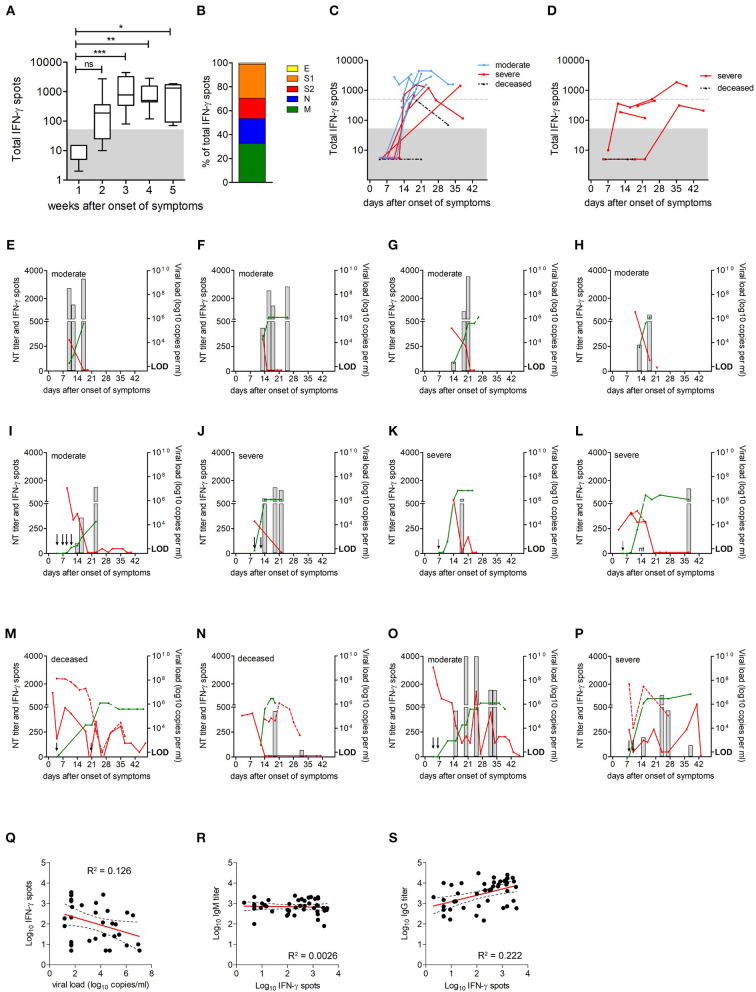
Figure 3.
Extent of SARS-CoV-2-specific CD4 T cell responses over time. (A) Extent of CD4 T cell responses to the four SARS-CoV-2 structural proteins, as determined by IFN-γ ELISpot assays (n = 21); data are presented as box and whiskers plots, with bounds from 25th to 75th percentile,plots, with bounds from 25th to 75th percentile, median line, and whiskers ranging from minimum to maximum of total IFN-γ spots. Significance was determined by Kruskal Wallis test, *P < 0.05, **P < 0.01, ***P < 0.001. Area below cut off in IFN-γ ELISpot assay (<50 spots per 106 PBMCs) is shaded gray. (B) Percentage of spots contributed by S1, S2, M, N, and E. (C) Kinetics of CD4 T cell responses in patients with moderate or severe disease and in deceased patients; group one, moderate (blue circles); group two, severe (red squares) and group three, deceased (black triangles). (D) Kinetics of CD4 T cell responses in patients with corticosteroid therapy (n = 5); group two, severe (red squares) and group three, deceased (black triangles). Dotted gray lines indicate 500 spots (i.e., 10 times the cut-off of the ELISpot assay). Area below cut off in IFN-γ ELISpot assay (<50 spots per 106 PBMCs) is shaded gray. (E–P) CD4 T cell responses (gray columns), neutralizing antibody titers (green lines), and virus loads in nasopharyngeal swabs (red lines) or endotracheal aspirates (dotted red line) in individual patients. Arrows indicate time points of ELISpot assays with no detectable CD4 T cell reactivity; red star indicates discharge, negative PCR result was not obtained; nt, not tested; LOD, limit of detection. (Q–S) Correlations between virus-specific CD4 T cell levels and vRNA loads, anti-S IgG, or IgM ELISA titers were assessed using Pearson correlation.

