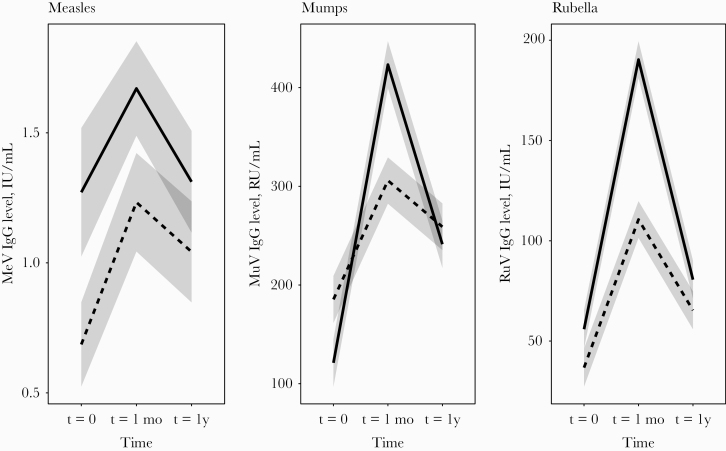
Figure 2.
A linear mixed model was used to directly compare the dynamics in IgG antibody response to measles, mumps, rubella after a second measles-mumps-rubella vaccine dose (MMR2; solid lines) or a third MMR vaccine dose (MMR3; dashed lines). Abbreviations: t = 0, time point before MMR vaccination; t = 1, 1 month or 4 weeks after, respectively, a second or third dose of measles-mumps-rubella vaccine (MMR2 or MMR3); t = 1y, time point 1 year after MMR vaccination.

