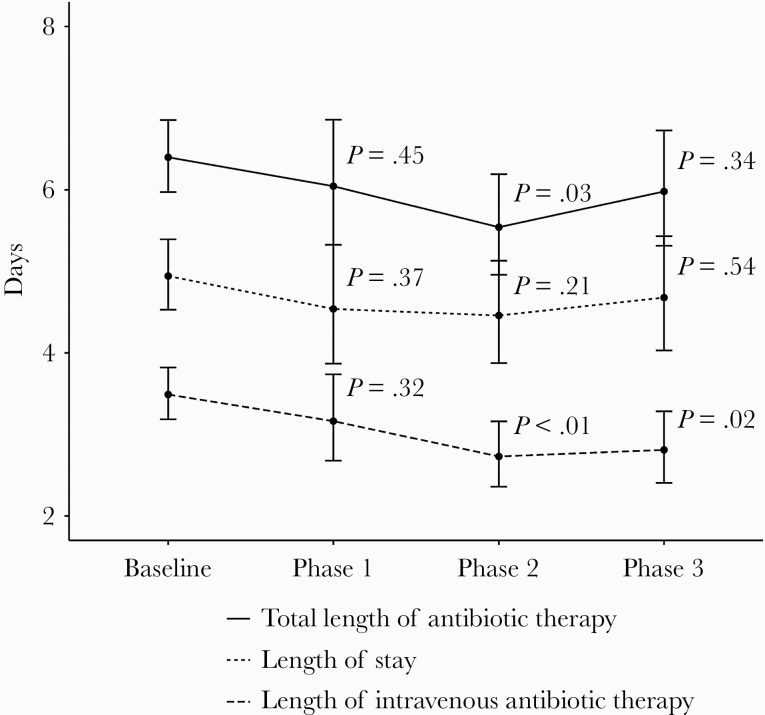
Figure 2.
Intravenous antibiotic therapy length, total antibiotic therapy length, and length of stay by phase. Estimated marginal means, 95% confidence intervals, and P values are based on gamma regression models adjusted for age, Charlson comorbidity index, CURB-65 (confusion, urea >7mmol/L, respiratory rate ≥30/min, systolic blood pressure <90 mmHg, and age ≥65 score), and flu season, with visits with length of stay >30 days excluded. P values are based on the following comparisons: Baseline/Phase 1, Baseline/Phase 2, and Baseline/Phase 3.

