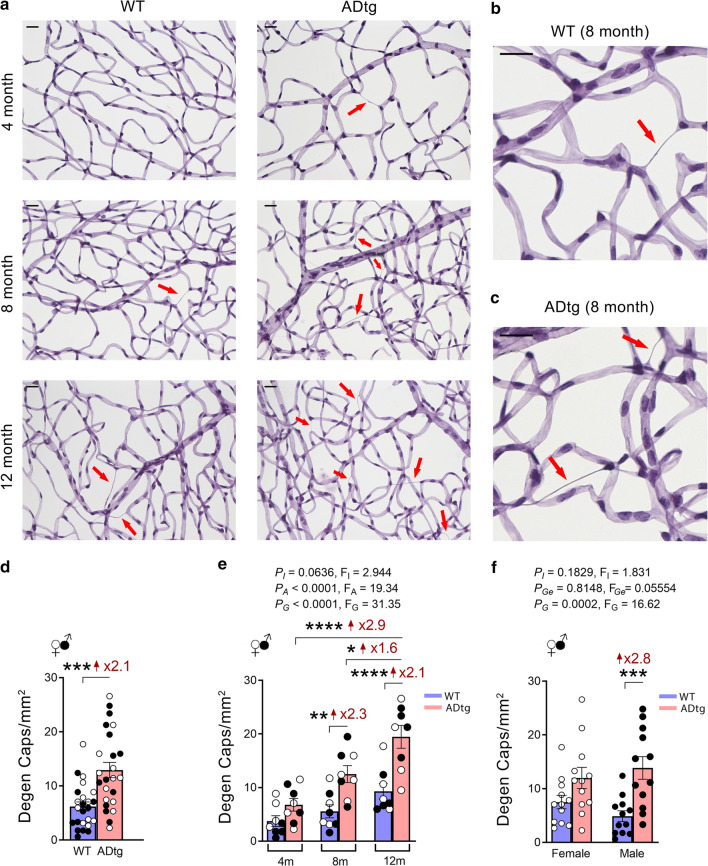
Fig. 1.
Identification of retinal capillary degeneration in APPSWE/PS1ΔE9 (ADtg) mice that intensified during disease progression. ADtg mice and their age- and sex-matched wild-type (WT) littermates, males and females in equal number, were used in this study at the age of 4 (n = 16; ADtg = 8 and WT = 8), 8 (n = 16; ADtg = 8 and WT = 8) and 12 (n = 16; ADtg = 8 and WT = 8) months. a Representative images of periodic acid-Schiff (PAS)-stained, hematoxylin-counterstained isolated retinal microvasculature from ADtg and matched WT littermates. Acellular degenerated retinal capillaries are indicated by red arrows. b–c Higher magnification representative images of acellular, degenerated retinal capillaries from 8-month-old b. WT mouse and c ADtg mouse (red arrows indicate degenerated capillaries). Scale bars = 20 µm. d Count of acellular degenerated retinal capillaries (Degen Caps) in 1 mm2 microscopic fields as manually determined in ADtg and WT control mice (mean age: 8 months, 50% females for both WT and ADtg groups). e–f Numbers of degenerated retinal capillaries when mice are stratified by mouse genotypes, WT or ADtg, by either e age groups of 4, 8 and 12 months or f sex. Data from individual mice (circles) as well as group means ± SEMs are shown. Black-filled circles represent males and clear circles represent females. Fold changes are shown in red. *p < 0.05, **p < 0.01, ***p < 0.001, ****p < 0.0001, by two-way ANOVA with Tukey’s post hoc multiple comparison test or by unpaired 2-tailed Student t-test. P and F values of two-way ANOVA refer to comparisons of age groups (PA, FA), ADtg versus WT genotype groups (PG, FG), gender groups (PGe, FGe), and overall interactions (PI, FI)

