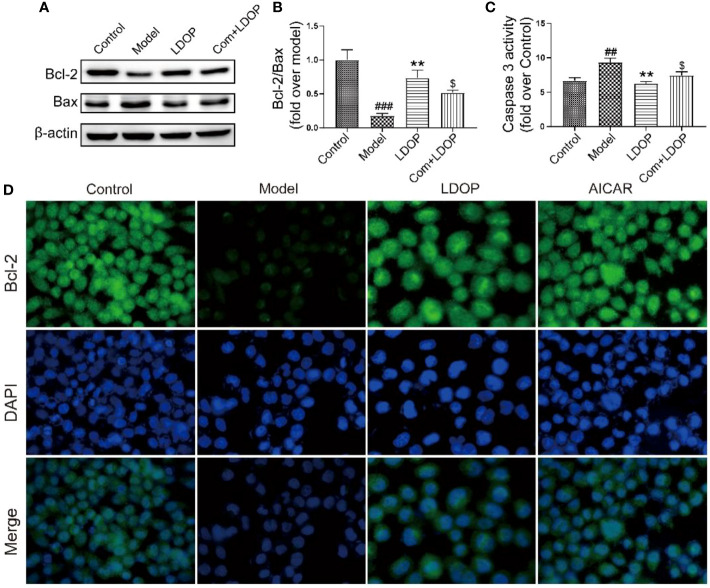
Figure 11.
LDOP-1 inhibited the expression of Bax, caspase 3 and boost of Bcl-2. (A) The expression of Bax and Bcl2 detected by Western blot. (B) Statistical analysis on ratio of Bax to Bcl-2. (C) The production of caspase 3 detected by biochemical markers kit. (D) Immunohistochemical image of Bcl2 measured by immunofluorescence technique. Data are expressed as the mean ± SD of three independent experiments. ##P < 0.01, ###P<0.001 compare the control group; **P < 0.01 compare model group. $P < 0.05 compare with LDOP-1 group. LDOP stood for LDOP-1.

