
Figure 2.
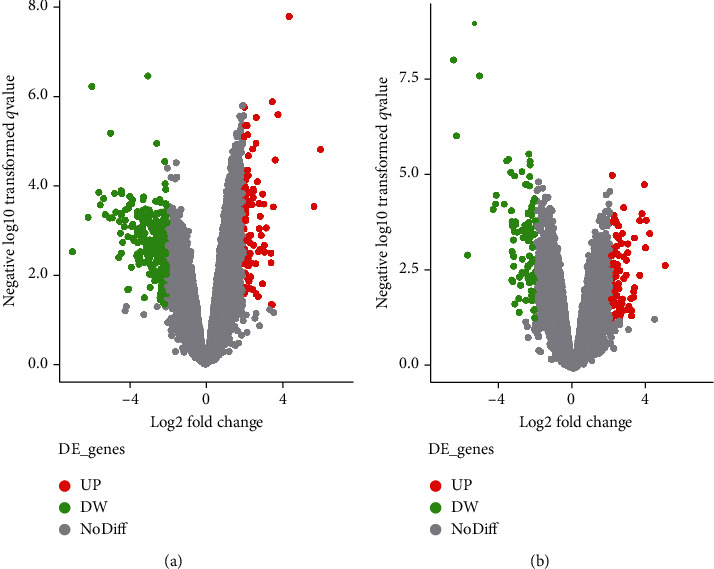
Volcano plot of the DEGs in the gene expression dataset GSE111762. (a) Red color is indicative of upregulated genes and green color of downregulated genes in normal vs. Hp-GA. (b) Red color is indicative of upregulated genes and green color of downregulated genes in Hp-GA vs. Hp-GC. Gray color indicates genes that are not differentially expressed in a statistically significant manner (the cutoff values of FDR < 0.05 and ∣logFC | >2).