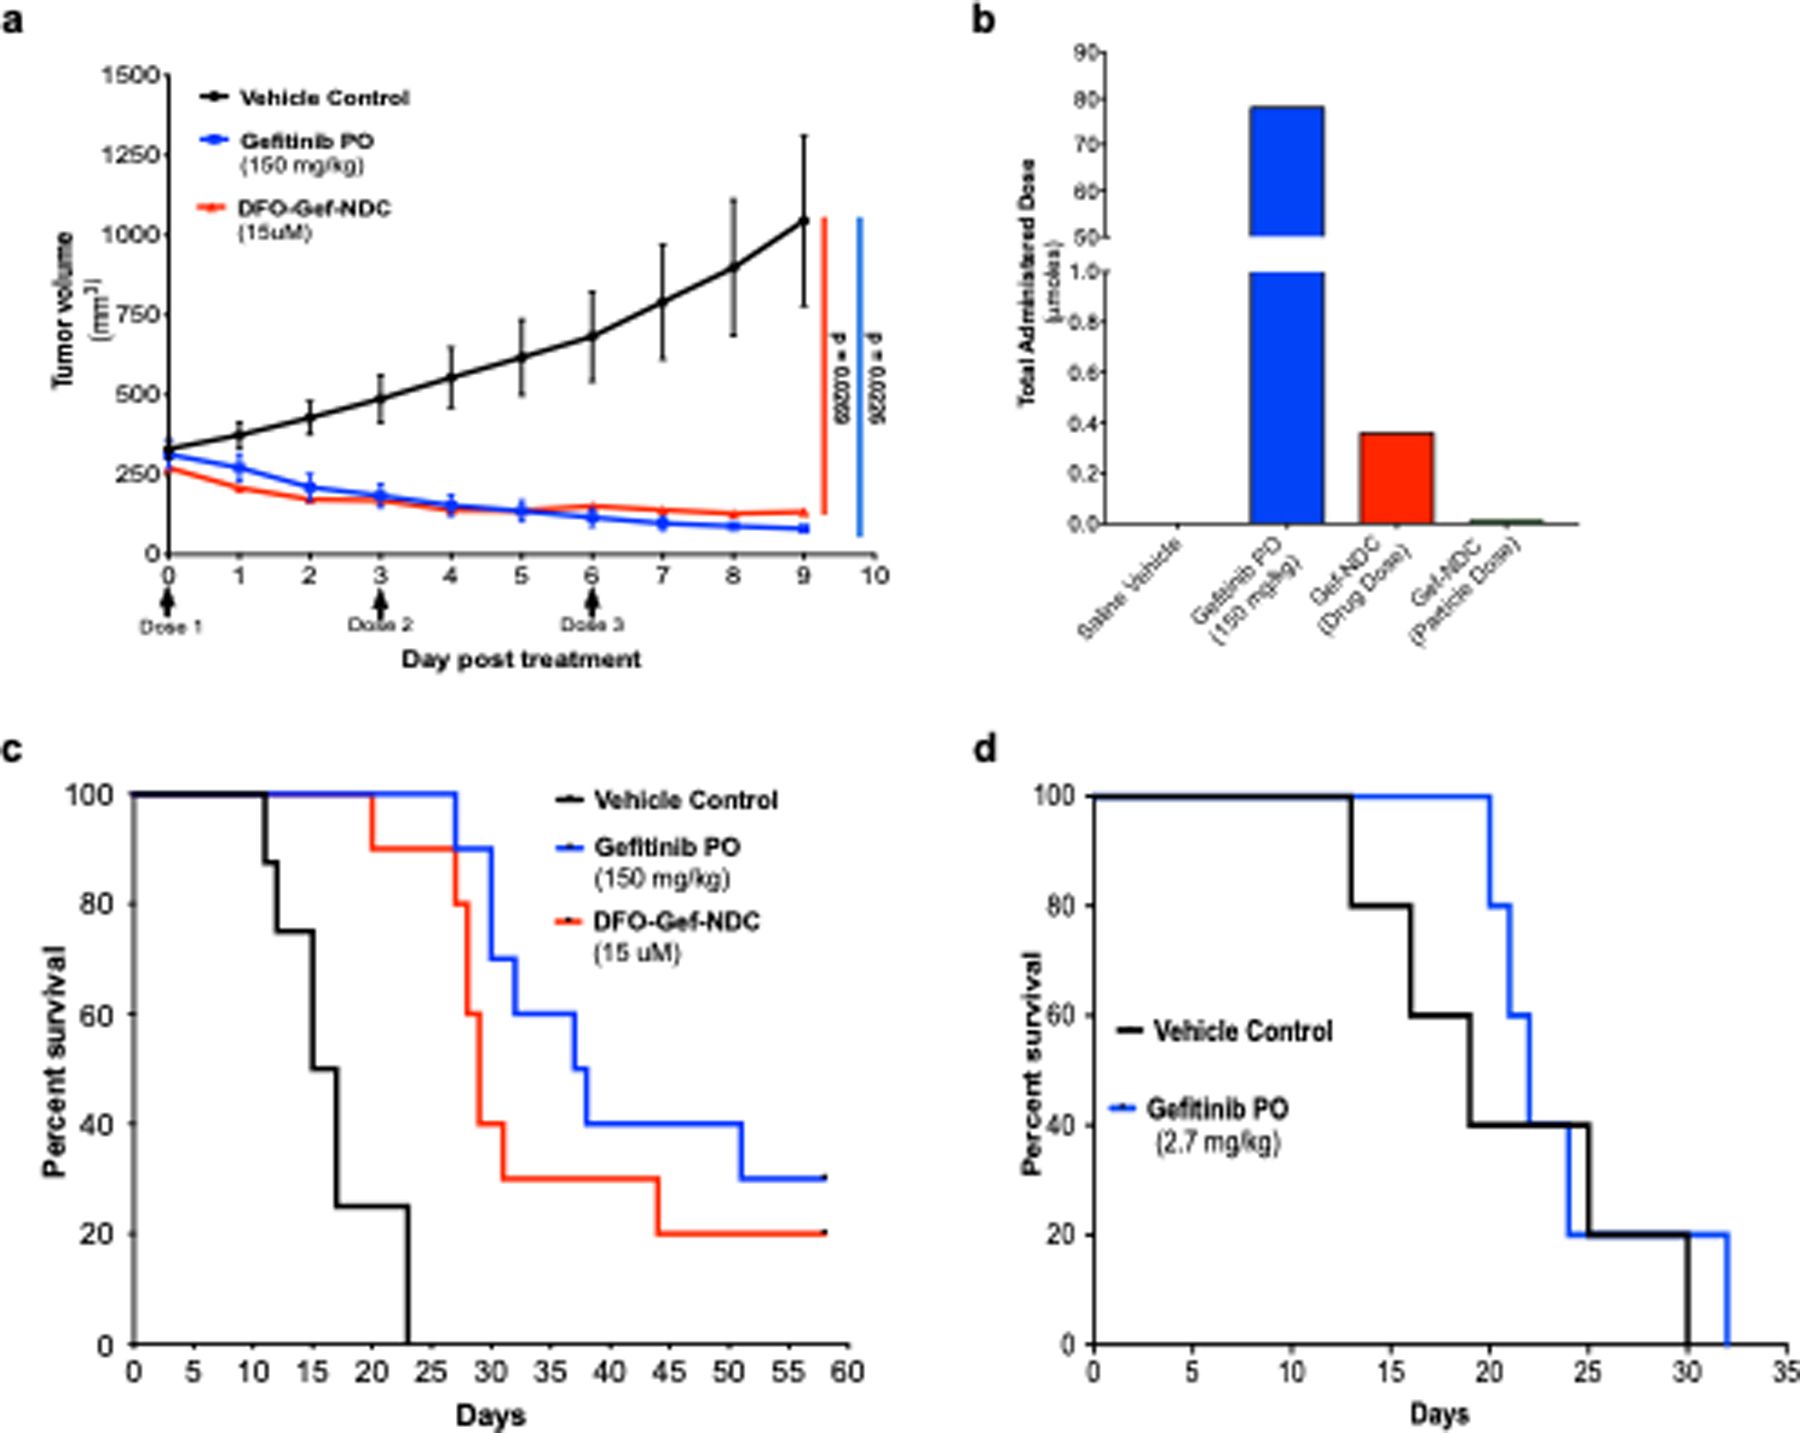
Figure 4. Treatment of ECLC26 tumors using a 200-fold smaller DFO-Gef-NDC dose than gefitinib results in nearly equivalent growth inhibition and overall survival.

a) Tumor growth inhibition curves of ECLC26 tumor-bearing mice (n = 3/group) treated with saline vehicle, free gefitinib (150 mg/kg/day; oral gavage), or DFO-Gef-C’ dots (Days 0, 3, 6; 200 μl of 15 μM; i.v.). b) Total administered dose of gefitinib across all treatment groups described in (a). Mouse receiving free gefitinib were administered a total dose of 78 μmoles, where DFO-Gef-C’ dot treated mice received a total dose of gefitinib equal to 360 nmoles. c) Kaplan-Meier curves depicting the overall survival of mice following an identical treatment paradigm to (a) (n = 10/group). Median survival times of vehicle, gefitinib, and DFO-Gef-C’ dot treated mice were 16, 37.5, and 29 days, respectively (Vehicle:Gefitinib PO p < 0.0001; Vehicle:DFO-Gef-C’ dots p < 0.0001; Gefitinib PO:DFO-Gef-NDC p = 0.2627). d) Kaplan-Meier survival curve for ECLC26 tumor-bearing mice treated with a DFO-Gef-C’ dot equivalent dose (i.e. 360 nmoles) of gefitinib versus vehicle control treated mice (p = 0.4944).
