
Figure 4.
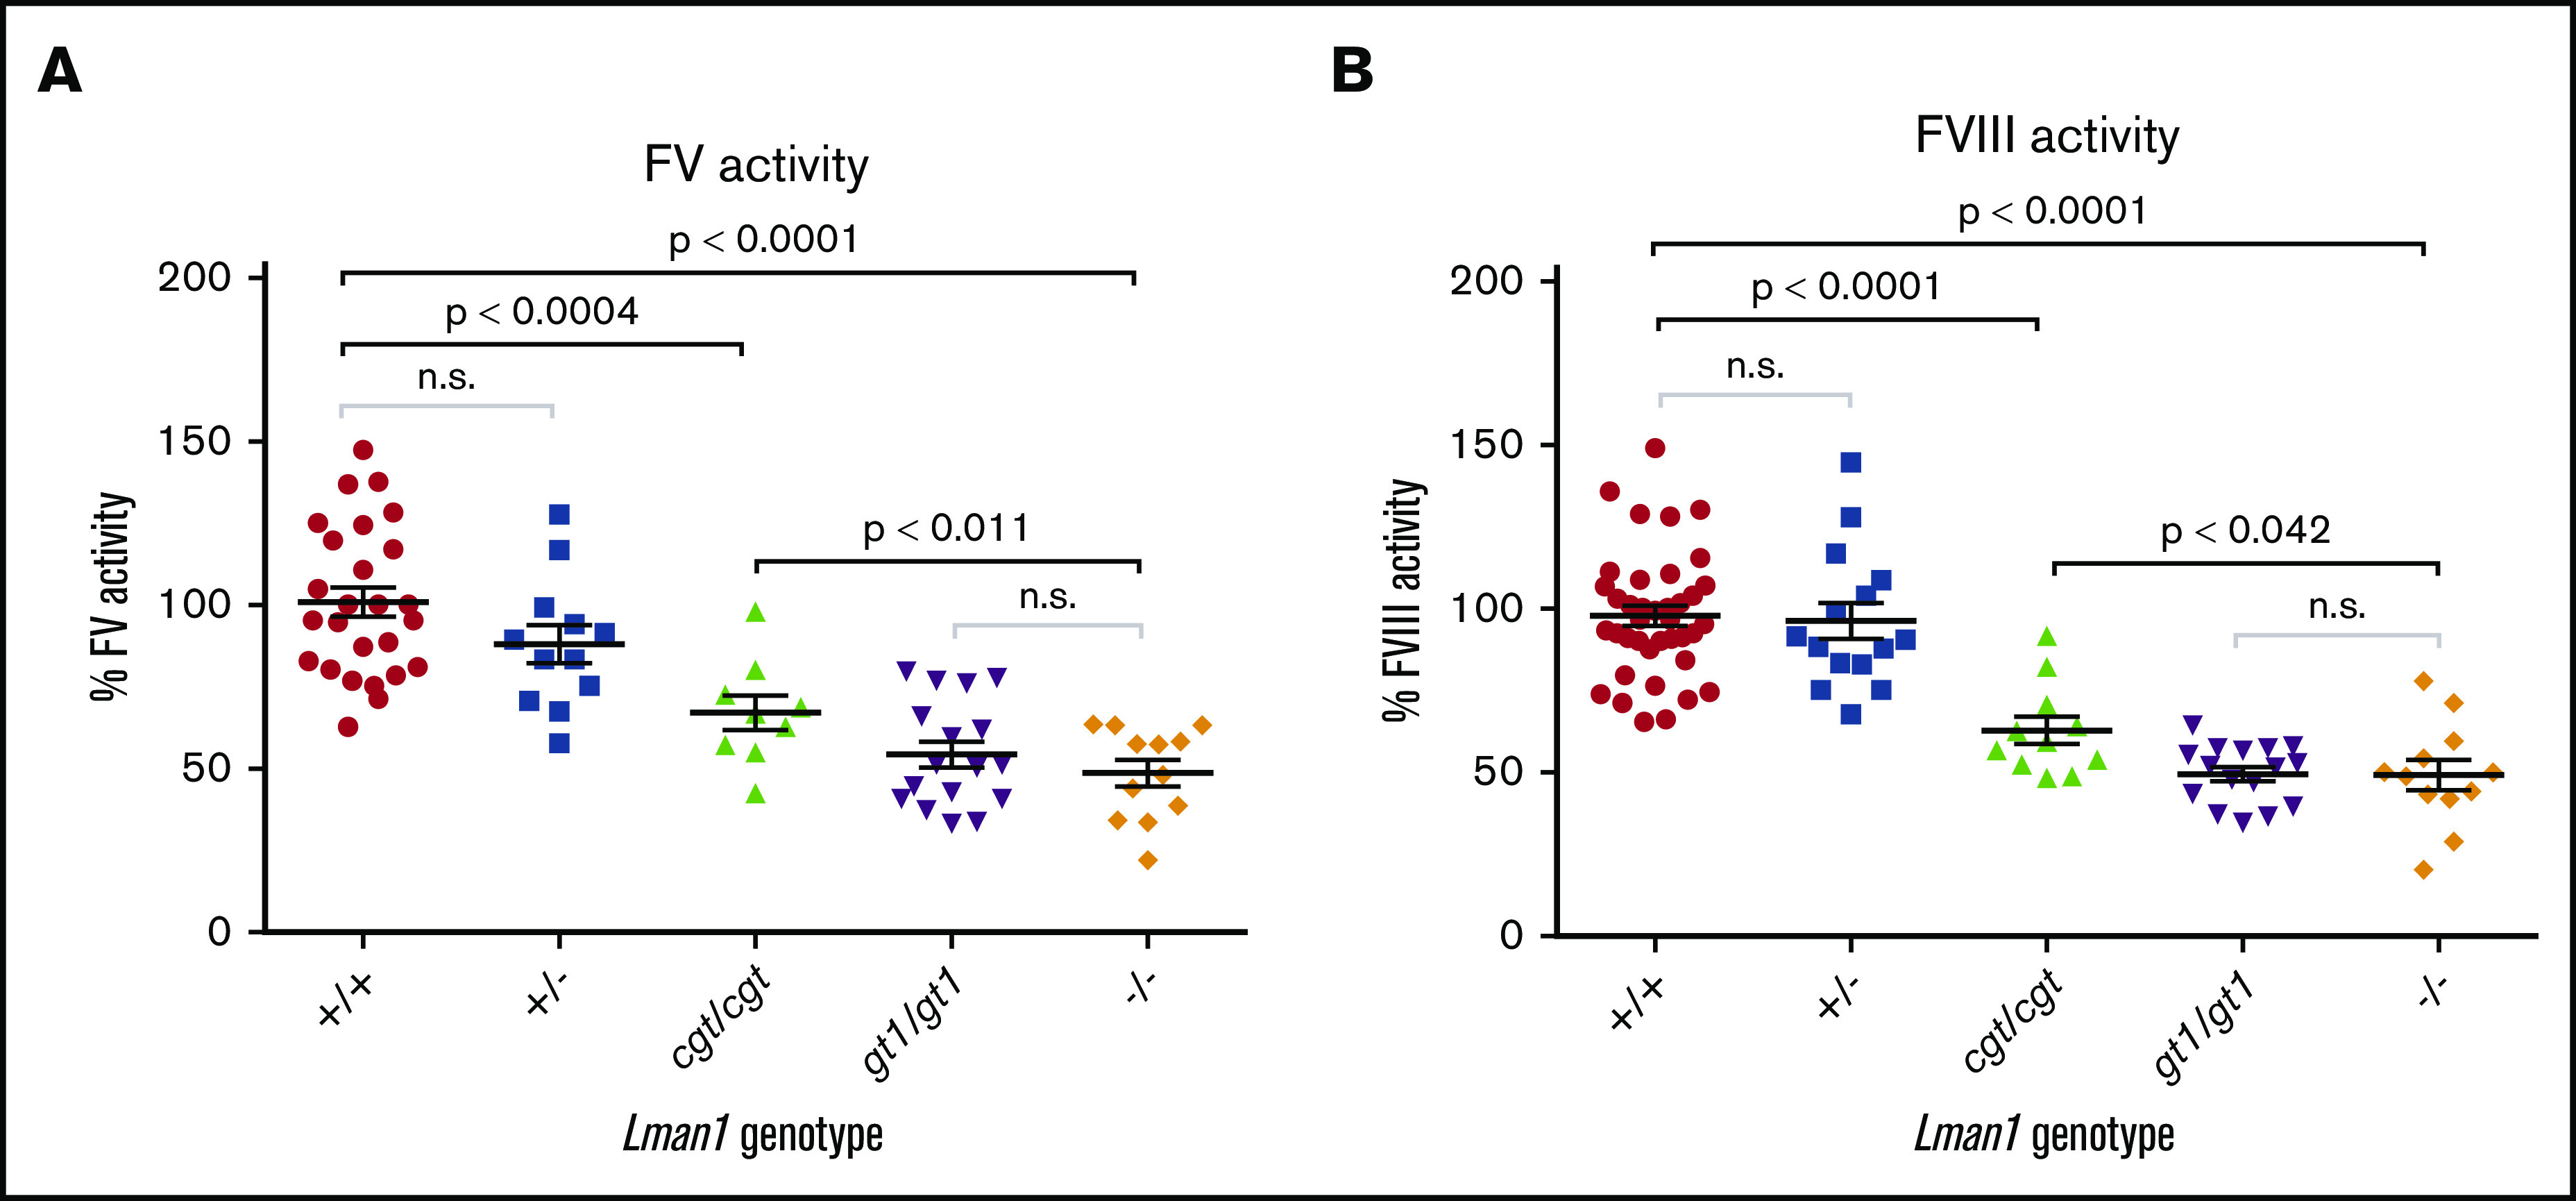
Plasma FV and FVIII activity levels for Lman1 mutant mice (C57BL/6J background). (A) Plasma FV activity as percentage of wild-type. (B) Plasma FVIII activity as percentage of wild-type. Each symbol represents an individual animal. Horizontal lines indicate mean, and error bars indicate standard error of the mean for each genotype.