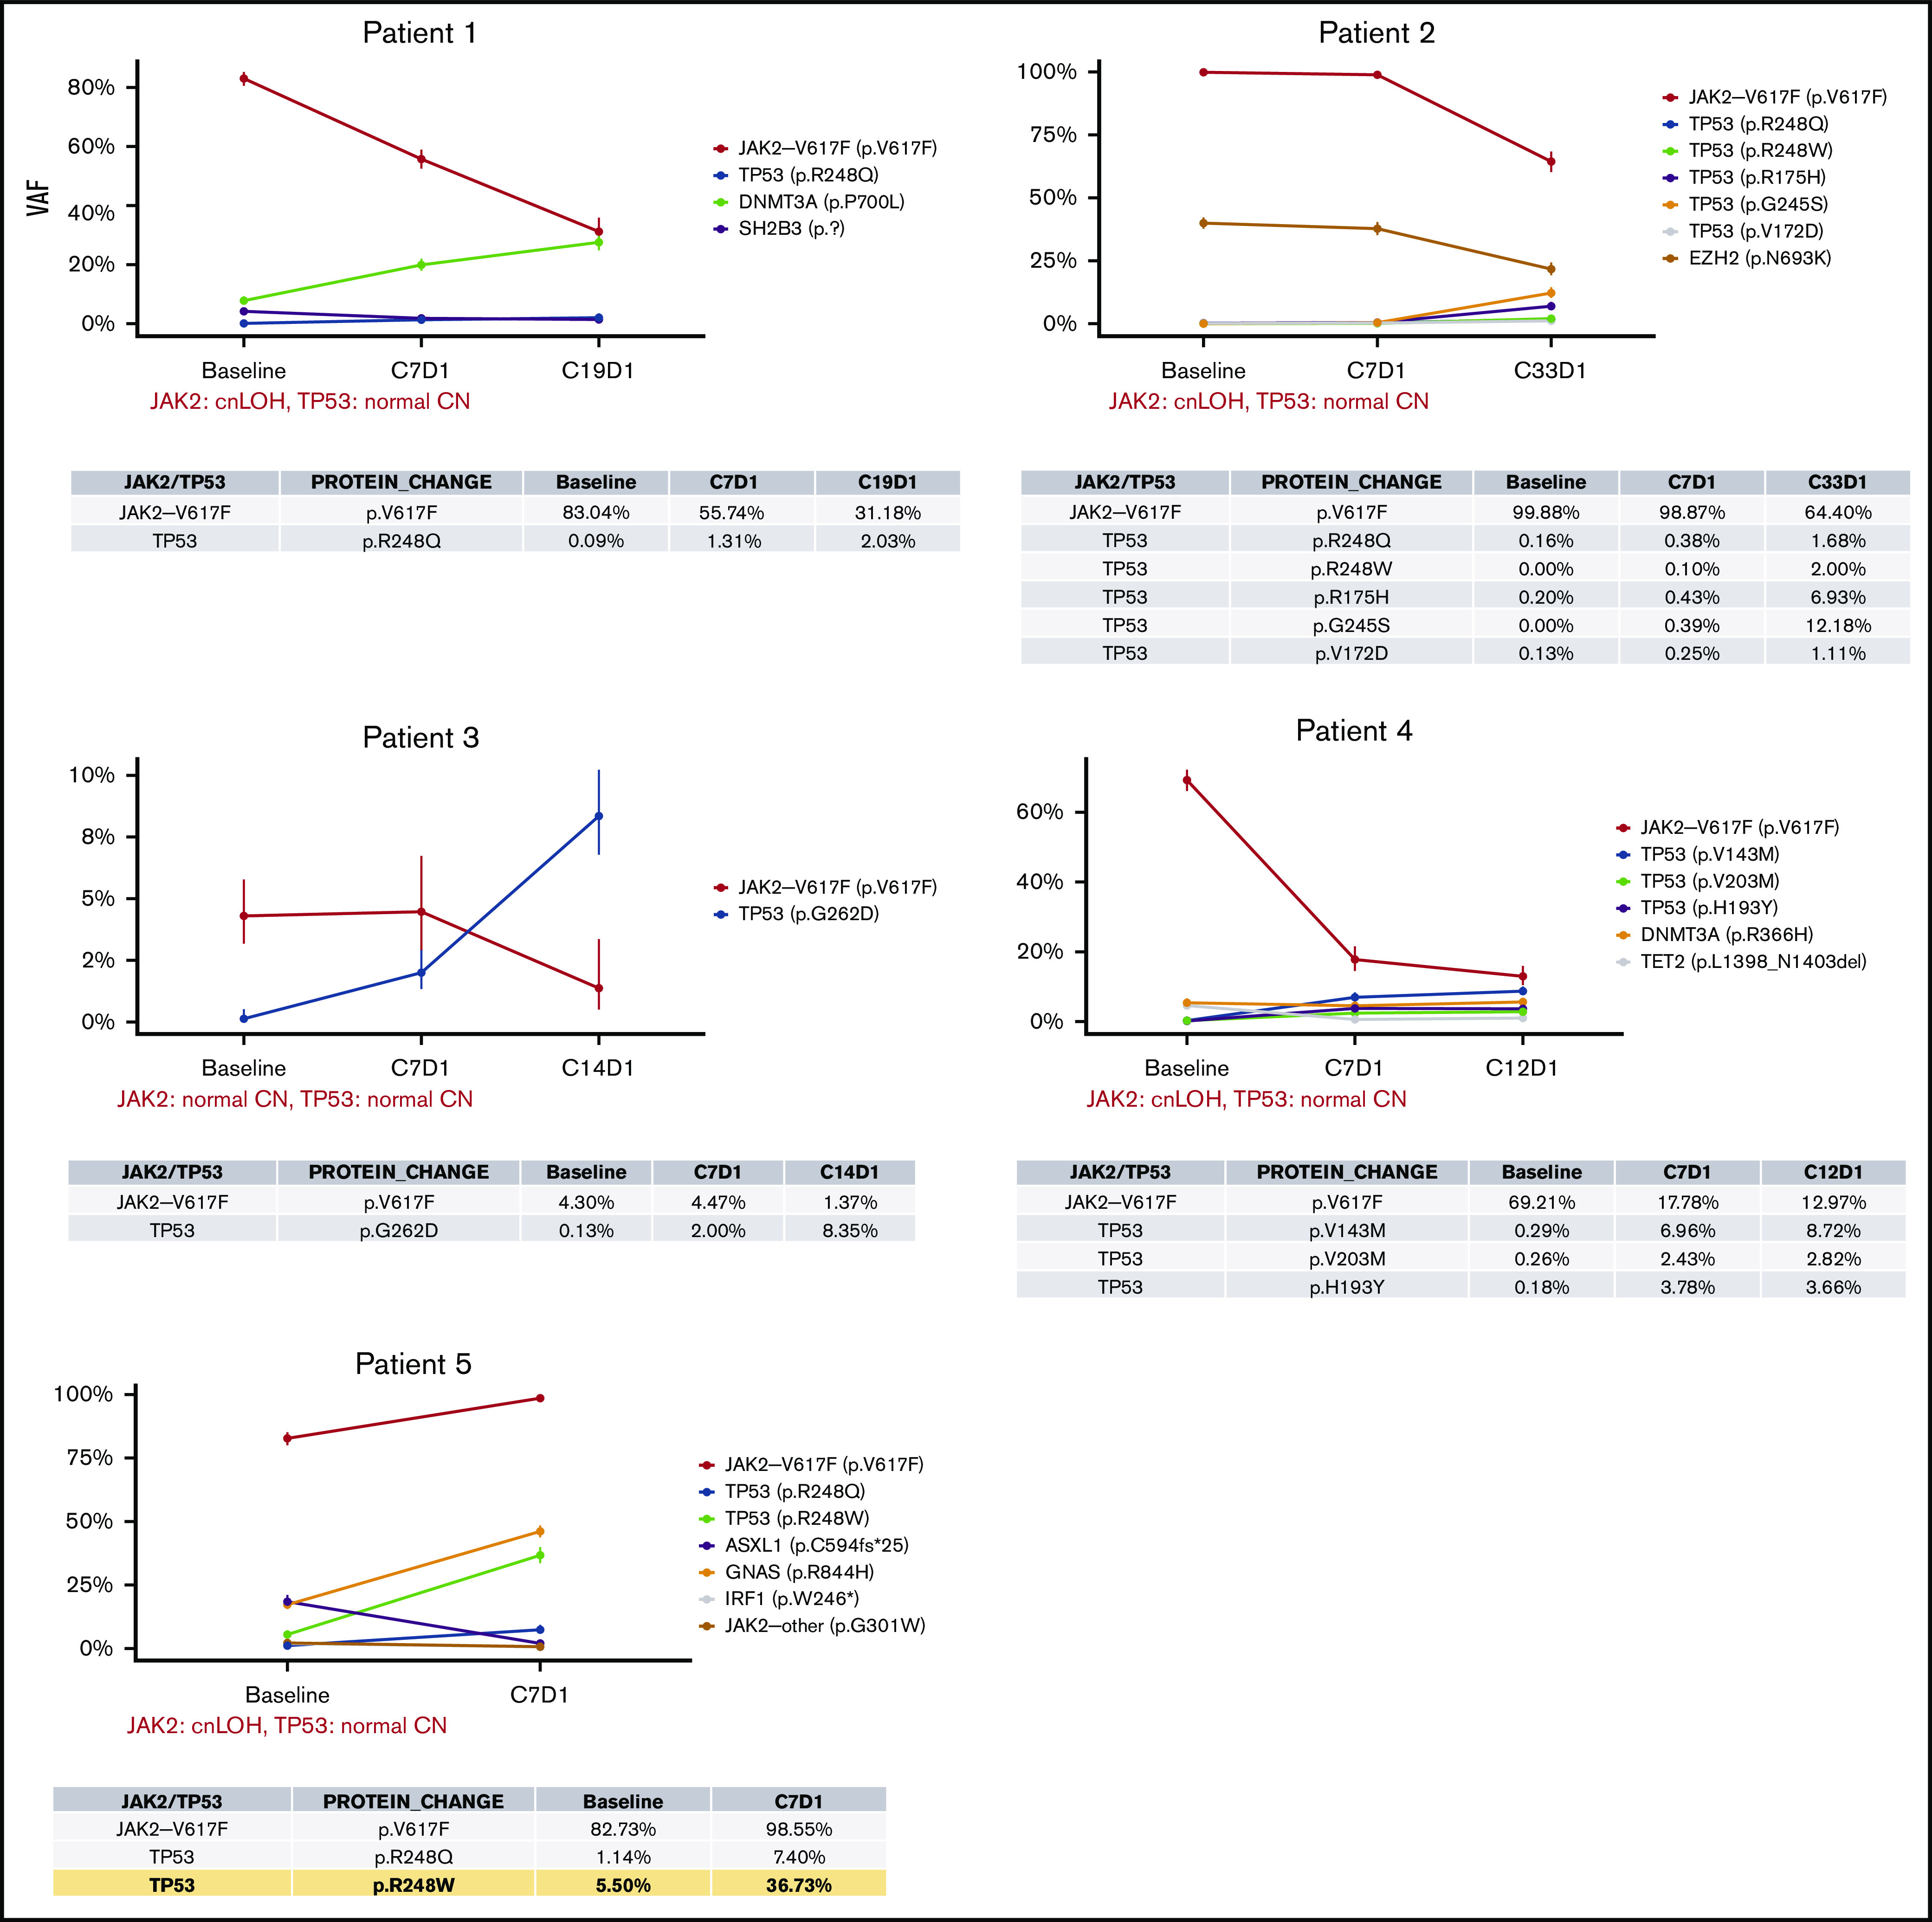
Figure 2.

Timeline profile of somatic mutations during idasanutlin therapy. Each panel depicts the VAF of somatic mutations in baseline and subsequent samples up to the last evaluable treatment time point during the therapy (4-33 months). The table below each graph details the VAFs of JAK2V617F and somatic TP53 mutations at each time point. The confidence intervals are calculated based on the sequencing depth at each locus, which are also listed in supplemental Table 1. In the data table for patient 5 (bottom left), the yellow highlights the largest increase in TP53 mutation VAF during the treatment that was observed in the cohort (R248W, ∼5.6 fold increase from baseline to C7D1). cnLOH, copy number neutral LOH.
