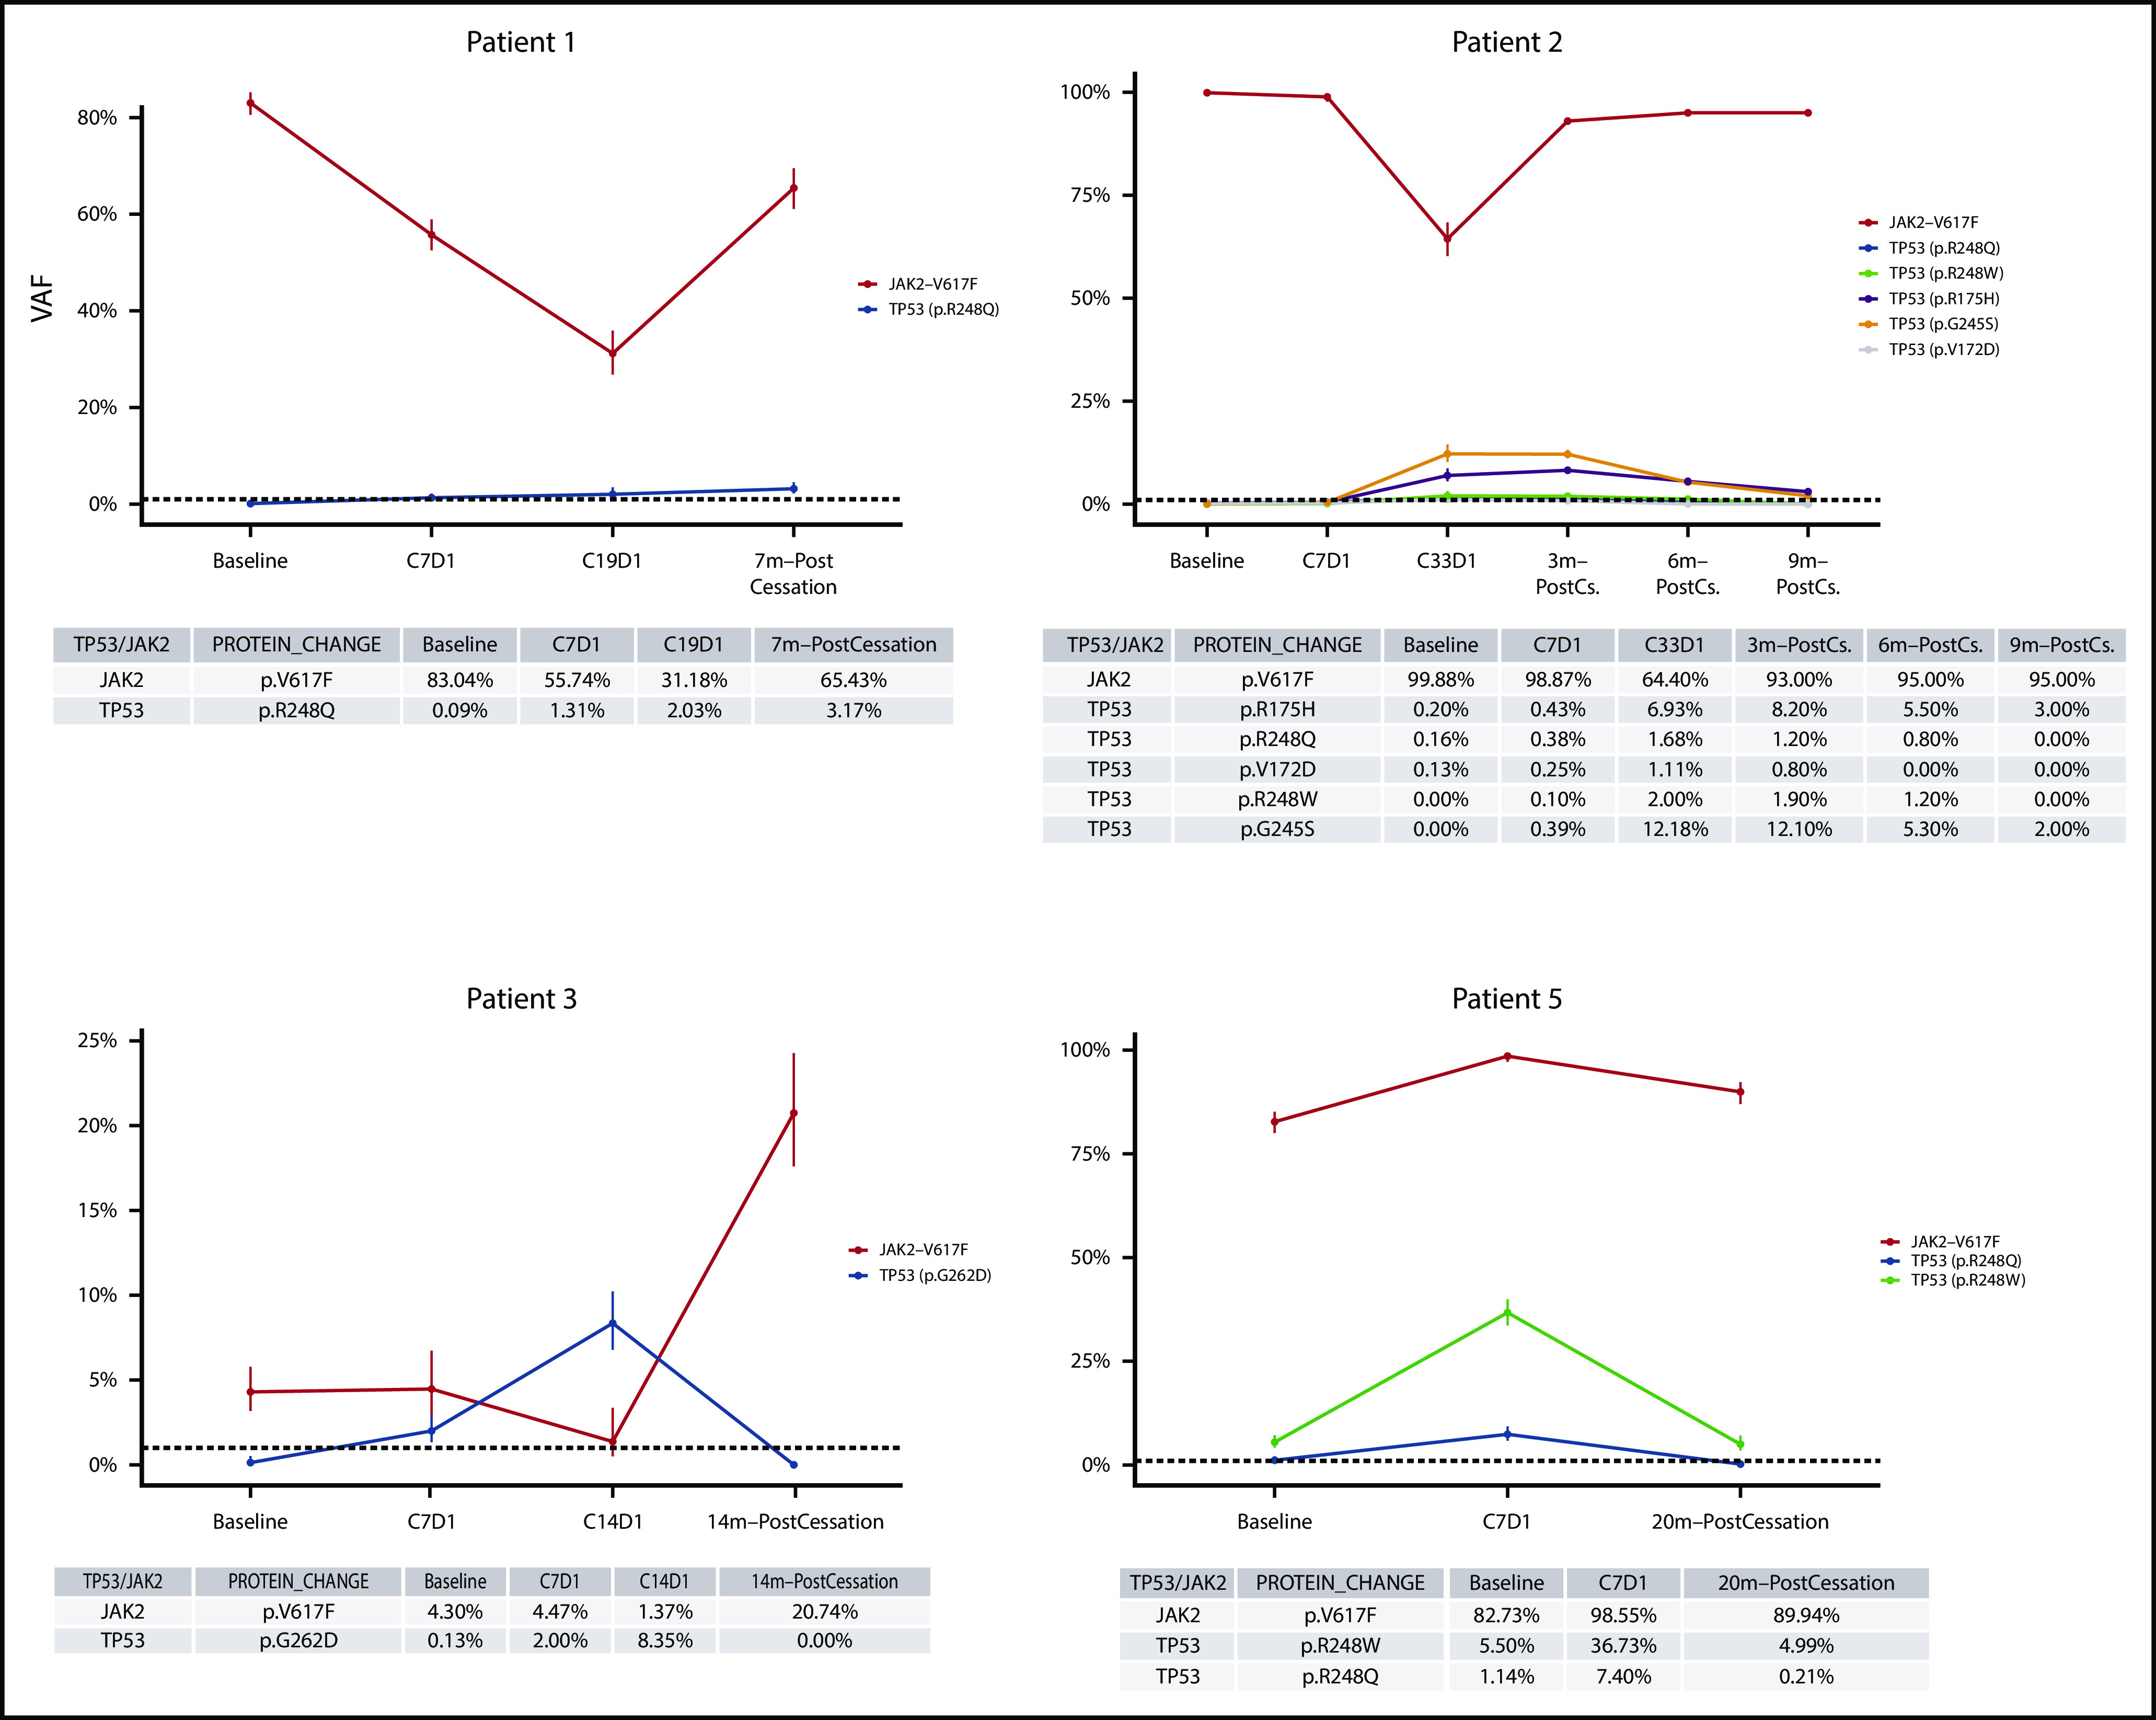
Figure 3.

Timeline VAF profile of JAK2V617F and TP53 mutants from baseline to follow-up. The panels present the timeline profile of JAK2V617F and TP53 mutations throughout the entire study for 4 patients who were available for follow-up. The VAF estimates (y-axis) during therapy are according to data from Memorial Sloan Kettering Cancer Center (International Working Group [IWG] panel), and the follow-up data are either from Genoptix (patients 1 and 3-5) or Saint-Louis Hospital (patient 2). The VAF error bars denote the confidence intervals as estimated by the sequencing depth (where available). The details of VAFs and depth at these mutation loci are presented in supplemental Table 1.
