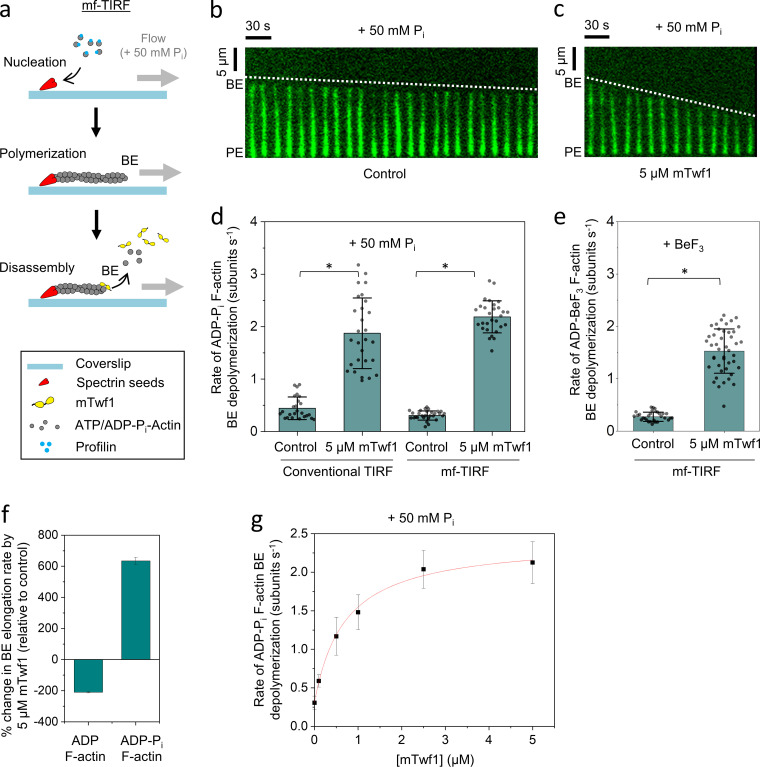
Figure 2.
mTwf1 accelerates the depolymerization of newly polymerized (ADP + Pi) actin filament barbed ends. (a) Schematic showing the experimental strategy for measuring barbed end depolymerization of ADP-Pi actin filaments in mf-TIRF assays. Actin filaments with free barbed ends were polymerized using coverslip-anchored spectrin-actin seeds by the addition of 2 µM G-actin (15% Alexa-488 labeled) and 5 µM profilin in mf-TIRF buffer containing 50 mM Pi. Next, mf-TIRF buffer (supplemented with 50 mM Pi) with or without 5 µM mTwf1 was introduced into the chamber, and depolymerization at barbed ends was monitored. Note that G-actin and profilin were no longer present when depolymerization was monitored. BE, barbed end; PE, pointed end. (b) Representative kymograph of Alexa-488–labeled actin filament (green) depolymerizing in mf-TIRF buffer with 50 mM Pi (Control). (c) Same as b but in the presence of 5 µM mTwf1. White dotted lines indicate the slope of depolymerizing barbed ends. (d) Rates (mean ± SD) of barbed end depolymerization with and without 5 µM mTwf1 in conventional TIRF versus mf-TIRF assays. *, Statistical comparison by two-sample t test between indicated conditions (P < 0.05). Number of filament ends analyzed for each condition (left to right): 25, 28, 29, and 29. Note that the scale in this panel is different than that in Fig. 1 c. (e) Rates (mean ± SD) of barbed end depolymerization in the presence of BeF3 with and without 5 µM mTwf1. *, Statistical comparison by two-sample t test between indicated conditions (P < 0.05). Number of filament ends analyzed for each condition (left to right): 77 and 109. (f) Percent change in the rate of barbed end depolymerization induced by 5 µM mTwf1 for ADP- (left) or ADP-Pi–actin (right) filaments (mean ± SEM for two replicates). (g) Rates (mean ± SD) of barbed end depolymerization for ADP-Pi filaments as a function of mTwf1 concentration in mf-TIRF. Number of filament ends analyzed for each concentration (left to right): 29, 45, 41, 36, 42, and 46. The line is a fit to a hyperbolic binding curve (see Materials and methods). Conventional TIRF experiments were performed two times and mf-TIRF experiments three times and yielded similar results. Data shown are from one experiment each.

