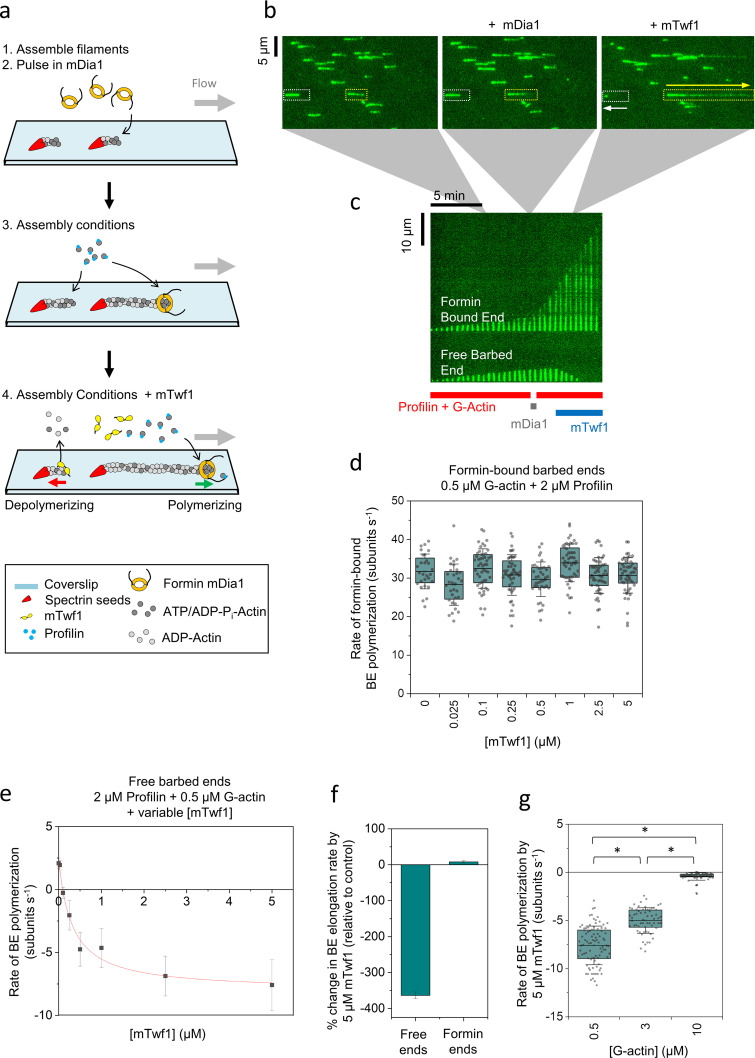
Figure 3.
mTwf1 induces depolymerization of newly polymerized barbed ends even under assembly-promoting conditions. (a) Schematic showing the experimental strategy for investigating the effects of mTwf1 on barbed ends in assembly-promoting conditions. Filaments with free barbed ends were polymerized by exposing coverslip-anchored spectrin-actin seeds to a flow containing 0.5 µM G-actin (15% Alexa-488 labeled) and 2 µM profilin. 20 nM mDia1 was then introduced for 20 s, which resulted in ∼20% of barbed ends being capped by mDia1. The filaments were then briefly exposed to 0.5 µM G-actin (15% Alexa-488 labeled) and 2 µM profilin in mf-TIRF buffer (<1 min) to identify the fast-growing mDia1-capped ends. Next, mf-TIRF buffer containing 0.5 µM G-actin (15% Alexa-488 labeled), 2 µM profilin, and 0–5 µM mTwf1 was introduced into the chamber, and barbed end dynamics were monitored. (b) Representative field of view showing filaments growing at their barbed ends before mDia1 flow in (left), then the same filaments growing at their free barbed ends (white dotted rectangles) or growing more rapidly at their mDia1-capped barbed ends (yellow dotted rectangles) in the presence of actin and profilin (middle), and finally the same barbed ends shortening or elongating, respectively, after flowing in 5 µM mTwf1 with G-actin and profilin (right). White arrow denotes a depolymerizing free barbed end, and the yellow arrow denotes a rapidly elongating formin-bound barbed end. (c) Kymographs of the same two filaments highlighted in b, grown in the presence of 0.5 µM G-actin and 2 µM profilin (red bar) before and after pulsing in 20 nM mDia1 (gray bar). Upon subsequent flow in of 5 µM mTwf1 with 0.5 µM G-actin and 2 µM profilin (blue bar), the free barbed end starts to depolymerize (bottom), while the mDia1-capped barbed end continues to rapidly elongate (top). (d) Rates (mean ± SD) of mDia1-capped barbed end elongation in the presence of 0.5 µM G-actin (15% Alexa-488 labeled), 2 µM profilin, and different concentrations of mTwf1. BE, barbed end. (e) Rates (mean ± SD) of free barbed end elongation in the presence of 0.5 µM G-actin, 2 µM profilin, and different concentrations of mTwf1. The red line is a fit to a hyperbolic binding curve (see Materials and methods). (f) Percent change in elongation rate by 5 µM mTwf1 (compared with control reactions) for free barbed ends versus mDia1-capped barbed ends (mean ± SEM for three replicates). Reactions contained 0.5 µM G-actin and 2 µM profilin, with or without 5 µM mTwf1. (g) Effects of 5 µM mTwf1 on rate (mean ± SD) of depolymerization of free barbed ends in the presence of different concentrations of profilin-bound actin monomers: 0.5 µM G-actin with 2 µM profilin, 3 µM G-actin with 4 µM profilin, and 10 µM G-actin with 15 µM profilin. *, Statistical comparison by two-sample t test between indicated conditions (P < 0.05). Number of filament ends analyzed for each condition (left to right): 90, 61, and 78. All experiments were performed at least three times and yielded similar results. Data shown are from one experiment each.

