Figure 5.
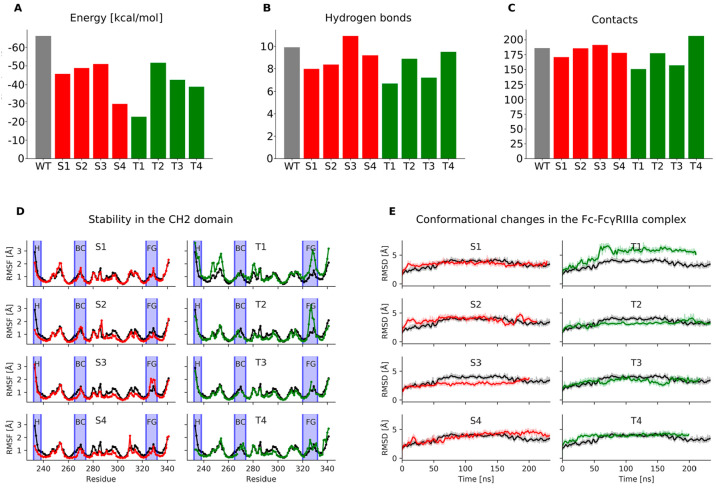
Fc-silencing potential and structural stability of the designed standard (red) and loop grafted (green) Fc variants in comparison to the wild-type Fc-FcγIIIa receptor complex (gray columns in A–C, black lines in D and E). A) Relative binding free energies between the Fc region and the FcγIIIa receptor, where the height of columns indicates binding affinity for the receptor (lower columns indicate reduced affinity); B) Average number of hydrogen bonds and C) van der Waals contacts formed between the Fc region and the FcγIIIa receptor. The N-glycan bound to Asn297 in the Fc region and the N-glycan bound to Asn162 in the FcγIIIa receptor were included in this calculation; D) Root mean square fluctuations measuring the stability of individual amino acid residues in the CH2 domain. Blue vertical ribbons indicate the hinge region and the BC and FG loops; E) Root mean square deviations measuring the conformational changes in the Fc region during molecular dynamics simulations.

