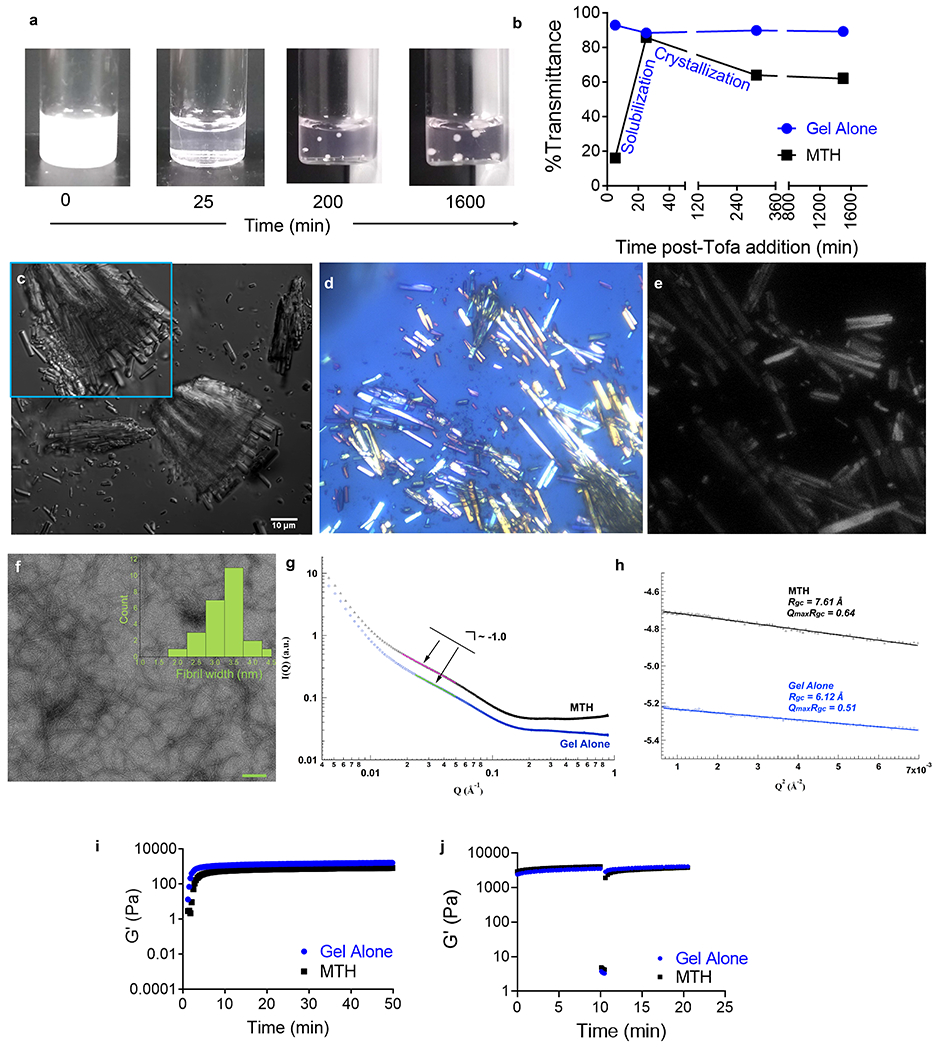
Figure 2.

(a) Visual change in phase behavior during the formation of MTH. (b) Transmittance as a function of time monitored during MTH formation compared to peptide 1 gel alone. (c) DIC micrograph of tofacitinib microcrystals within MTH (magnified in inset). Polarized microscopy (d) and second harmonic generation (e) of MTH showing crystalline nature of deposits. (f) TEM of peptide 1 fibrils isolated from MTH, scale bar (100 nm). Inset shows measured fibril widths (n = 25). (g) Power law fit of SAXs data for MTH and gel alone and (h) modified Guinier analysis deriving similar cross-sectional radii of gyration values. (i) Time-sweep oscillatory rheology of MTH comprising 16 mM tofacitinib, 5% (v/v) DMSO and 1% (w/v) peptide 1 compared to peptide 1 gel alone (1% w/v), frequency = 6 rad/s, strain = 0.2%. (j) Time-sweep shear thin-recovery oscillatory rheology of MTH and peptide 1 gel at 24 h. MTH in this Figure comprises 16 mM tofacitinib, 5% (v/v) DMSO and 1% (w/v) peptide 1.
