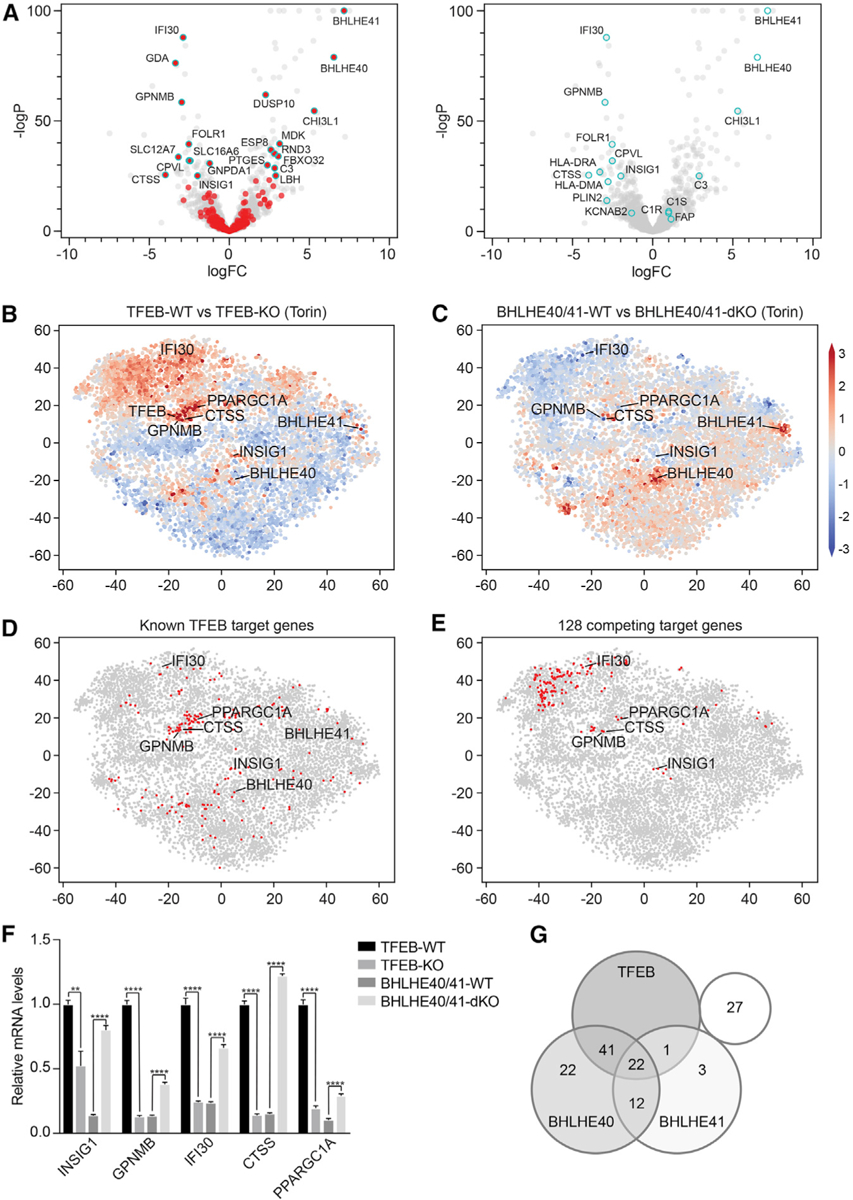
Figure 7. BHLHE40 and BHLHE41 Repress Expression of Select TFEB Target Genes through a Negative Feedback Loop.

(A) Volcano plots depicting differential gene expression in BHLHE40/41-WT versus BHLHE40/41-KO cells reconstituted cells at steady state. Highlighted in red (left panel) are genes significantly upregulated in TFEB-WT versus TFEB-KO cells following Torin treatment (logFC > ln4 and q < 0.01). Highlighted in cyan (right panel) are select TFEB target genes.
(B–E) tSNE plots representing all RNA sequencing datasets in our study. Comparison of RNA sequencing datasets from (B) TFEB-WT and TFEB-KO cells or (C) BHLHE40/41-WT and BHLHE40/41-dKO cells treated with Torin, in which each gene (dot) is colored by the logFC. (D) Known TFEB target genes or (E) strongest putative TFEB and BHLHE40/41 competing target genes are highlighted in red.
(F) Gene expression of select TFEB and BHLHE40/41 target genes in TFEB-KO, TFEB-WT, BHLHE40/41-dKO, and BHLHE40/41-WT cells as quantified by qRT-PCR. By two-tailed t test analyses, all genes were significantly upregulated in cells reconstituted with TFEB and downregulated in those reconstituted with BHLHE40/41. Data are representative from three independent experiments (mean ± SEM [standard error of the mean]). **p < 0.006, ****p < 0.0001.
(G) Venn diagram represents the number of the 128 strongest putative competing target genes (logFC > ln2 and < −ln2 in TFEB- and BHLHE40/41-WT versus TFEB- and BHLHE40/41-KO cells, respectively, and q < 0.05 in both) bound by TFEB, BHLHE40, and/or BHLHE41 based on the published ChIP-seq datasets GEO: GSM2354032, GSE106000, GSM2797493, and GSM2461743. See also Figure S6 and Tables S7 and S8.
