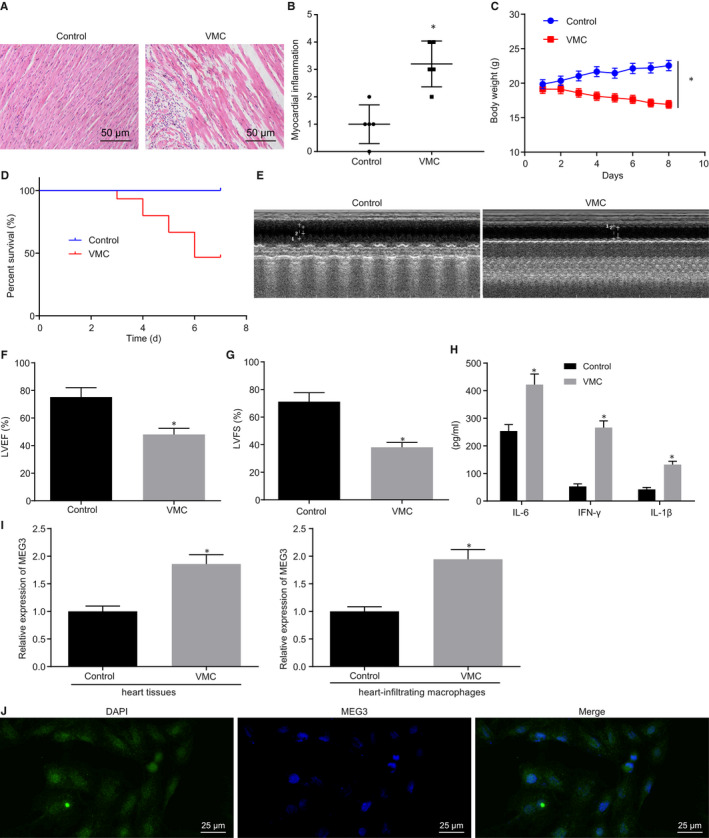
FIGURE 1.

MEG3 was expressed highly in viral myocarditis (VMC) mice. A, H&E staining of myocardial tissues (×200). B, Assessment of myocarditis grading according to results in A. C, Change of mouse body weight. D, Survival rate of mice. E, Echocardiography results of each group. F, Transthoracic echocardiography to determine LVEF. G, Transthoracic echocardiography to examine LVFS. H, Content of IFN‐γ, IL‐6 and IL‐1β in cardiac tissues measured by ELISA. I, MEG3 expression in myocardial tissues and infiltrated macrophages from cardiac tissues on the 7th day after establishment of the VMC model detected by RT‐qPCR. J, Subcellular localization of MEG3 evaluated by FISH assay. *P < 0.05 vs control mice. N = 5 or 10
