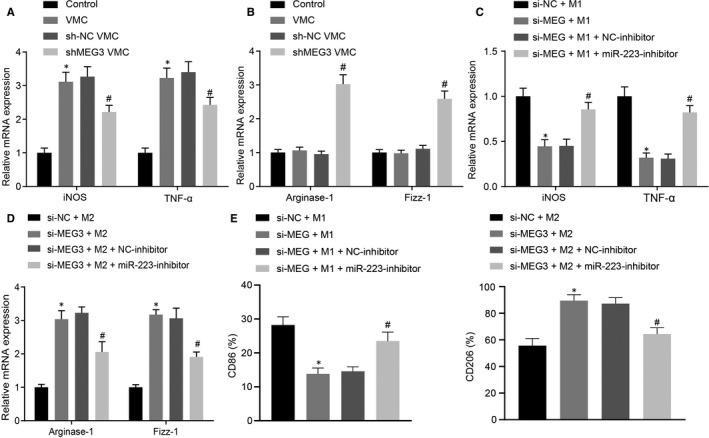
FIGURE 6.

Silencing of MEG3 inhibits M1 macrophage polarization but enhances M2 macrophage polarization via up‐regulating miR‐223. A, Levels of M1 macrophages markers iNOS and TNF‐α in cardiac infiltrated macrophages of viral myocarditis (VMC) mice after down‐regulation of MEG3 determined by RT‐qPCR. B, Levels of M2 macrophages markers Arginase‐1 and Fizz‐1 in cardiac infiltrated macrophages of VMC mice after down‐regulation of MEG3 examined by RT‐qPCR. *P < 0.05 vs control mice; # P < 0.05 vs VMC mice injected with sh‐NC. N = 10. C, Levels of iNOS and TNF‐α after down‐regulation of MEG3 and miR‐223 detected by RT‐qPCR in vitro. D, Levels of Arginase‐1 and Fizz‐1 after down‐regulation of MEG3 and miR‐223 monitored by RT‐qPCR in vitro. E, Levels of CD86 (marker of M1) and CD206 (marker of M2) after down‐regulation of MEG3 and miR‐223 analysed by flow cytometry assay. The measurement data were described as mean ± SD, which was analysed by unpaired t test. *P < 0.05 vs the treatment of si‐NC + M1 or M2; # P < 0.05 vs the treatment of si‐MEG + M1 or M2 + NC inhibitor. The experiment was repeated 3 times
