FIGURE 3.

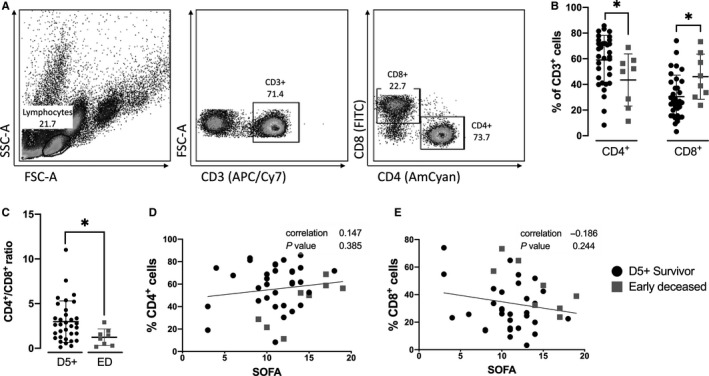
Changes in T cells frequency of patients with septic shock. A, Gating strategy used for T cell phenotyping. Lymphocytes were gated from an FSC x SSC plot. CD3+ T cells were used to distinguish CD4+ and CD8+ T cells. Singlet and live/dead gating strategy plot not shown. B, Differences in CD4+ and CD8+ cell subsets. There were significantly fewer CD4+ cells and significantly more CD8+ cells in early deceased patients in day 5+ survivors. C, Ratio of CD4+/CD8+ cells in D5+ survivors in comparison to early deceased patients. D and E, Correlation between frequency of CD4+ and CD8+ T cells and sepsis severity (SOFA score). Data were tested by Mann‐Whitney test, error bars are represented by SD. Correlation statistics (Spearman analysis) were performed using Graphpad software. *(P < 0.05), **(P < 0.01), ***(P < 0.001)
