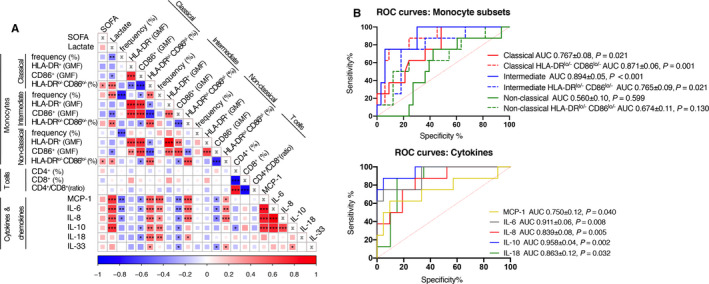
FIGURE 4.

Correlogram of monocytes and T cells’ parameters with produced cytokines. A, Monocyte parameters (Figure 1), T cell parameters (Figure 3) and levels of secreted cytokines (Figure 2) were analysed together. Positive correlations between parameters are displayed in red and negative correlations in blue. The colour intensity and size of the square are proportional to the correlation coefficients. The decreased frequency of classical monocytes strongly negatively correlates with changes of frequency in intermediate and non‐classical monocytes. Importantly, the correlations were found between both activation markers, HLA‐DR and CD86, in all monocyte subsets. Changes in classical monocytes frequency also negatively correlate with MCP‐1, IL‐6 and IL‐8. Contrary to classical monocytes, intermediate monocytes positively correlate with majority of measured cytokines. Important negative correlations were found between CD86 expressed on all monocyte subsets with different cytokines. The reduced frequency of CD4+ cells highly negatively correlate with increased frequency of CD8+ cells (P < 0.001). Visualization was done in R studio by corrplot package. *(P < 0.05), **(P < 0.01), ***(P < 0.001). B, ROC curve analysis was performed to evaluate the potential to predict five‐day survival, monocyte subsets showed significant predictive potential. AUC, area under curve; GMF, geometric mean of fluorescence; SOFA, sequential organ failure assessment
