FIGURE 2.

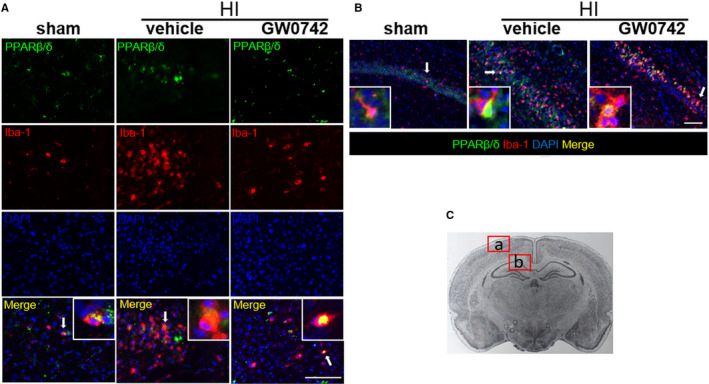
PPAR‐β/δ is expressed in microglia in neonatal rat brain. A, Representative immunofluorescence staining of PPAR‐β/δ and the microglia marker Iba‐1 in the cerebral cortex at 72 h post‐HI. B, Representative immunofluorescence staining of PPAR‐β/δ and the microglia marker Iba‐1 in the hippocampus at 72 h post‐HI. PPAR‐β/δ was colocalized with Iba‐1 in the sham, vehicle and GW0742 treatment (25 μg/kg) group. Compared with the sham and vehicle group, there was higher nuclear expression of PPAR‐β/δ in microglia in GW0742 treated group. C, Panel indicates the location of staining showed in (A, B). Picture taken from: Paxinos and Watson. The rat brain in stereotaxic coordinates. Green is for PPAR‐β/δ, red is for Iba‐1, and blue is for DAPI. Arrows indicate cells, which are shown in higher magnification in the insets. 2 rats for each group. Scale bar‐ 100 μm
